JetBrains Plugin for LeetCode
Relationship Between the Plugin and the Site
The solutions and ideas in the plugin come from the site's articles and exercise explanations. It serves as a supplementary tool for learning and is not mandatory. Please choose based on your needs.
Some readers prefer coding in an editor or IDE rather than on a web page, finding it more convenient for writing and debugging. Therefore, I have developed and maintained plugins across platforms to meet this demand, allowing readers to view the site's problem explanations, visualizations, and problem lists within the plugin.
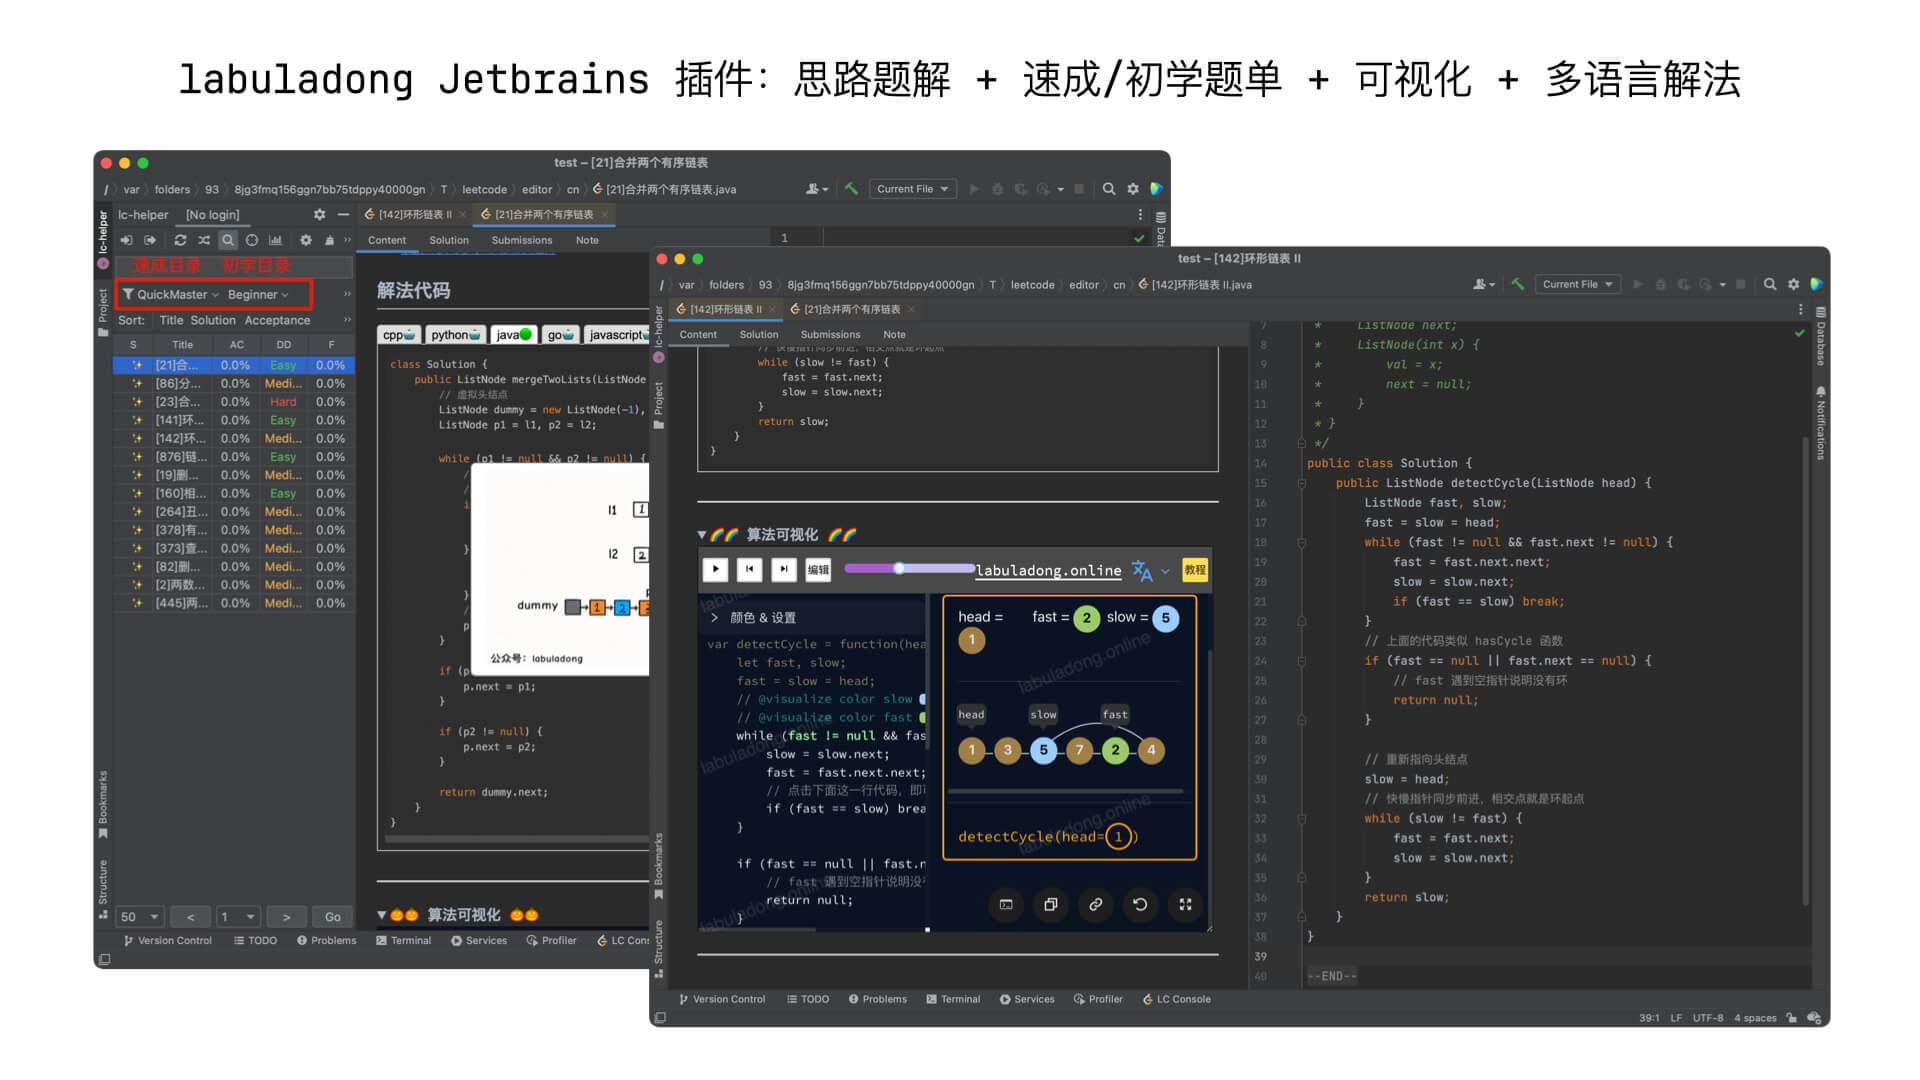
The JetBrains plugin allows users to solve LeetCode problems in all JetBrains IDEs (such as Intellij, Pycharm, etc.), supporting line-by-line debugging. You can directly view the site's explanation, visualization panels, and access the problem lists from the Quick Mastery Catalog and Beginner's Catalog for easy review:
The plugin is developed based on the open-source plugin LeetCode Editor, a tribute to the open-source author @shuzijun!
Installation Method
The full name of my plugin is "LeetCode with labuladong". It can be downloaded by searching for the keyword "labuladong" in the JetBrains series IDE plugin store:
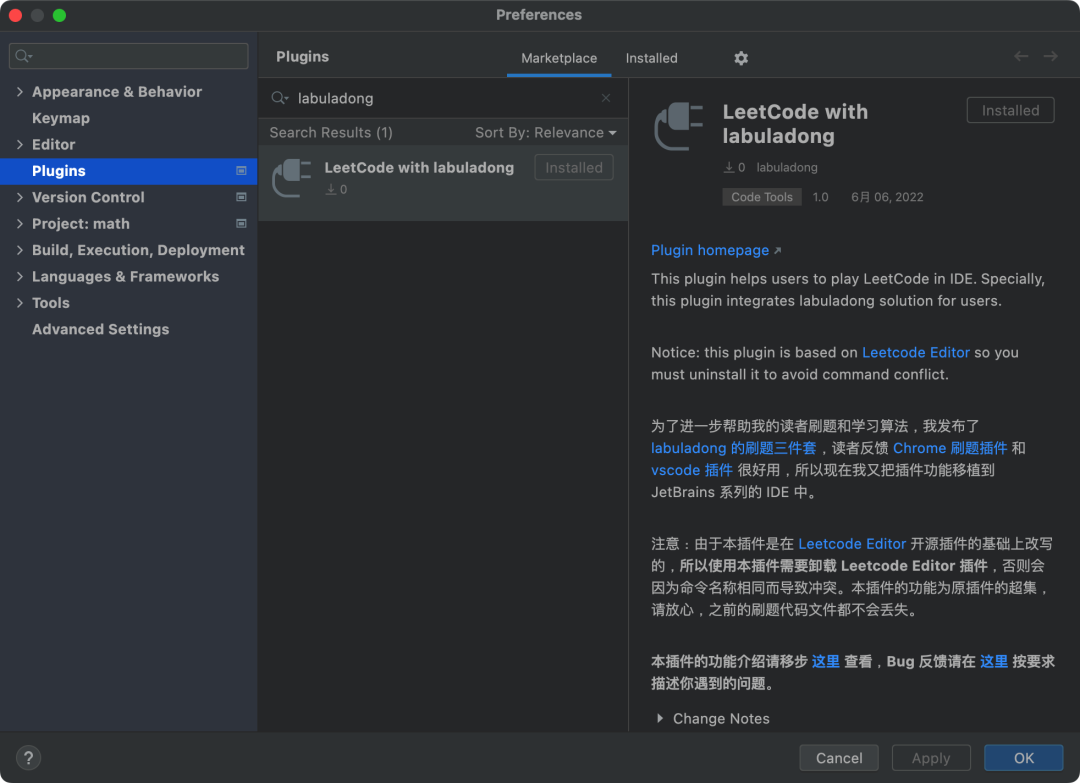
If the plugin cannot be found, it may be a network issue. Installation instructions can be followed on the JetBrains plugin webpage:
https://plugins.jetbrains.com/plugin/19317-leetcode-with-labuladong
Below is an introduction to the basic usage of this plugin and its supplementary features for solving problems.
Feature Demo
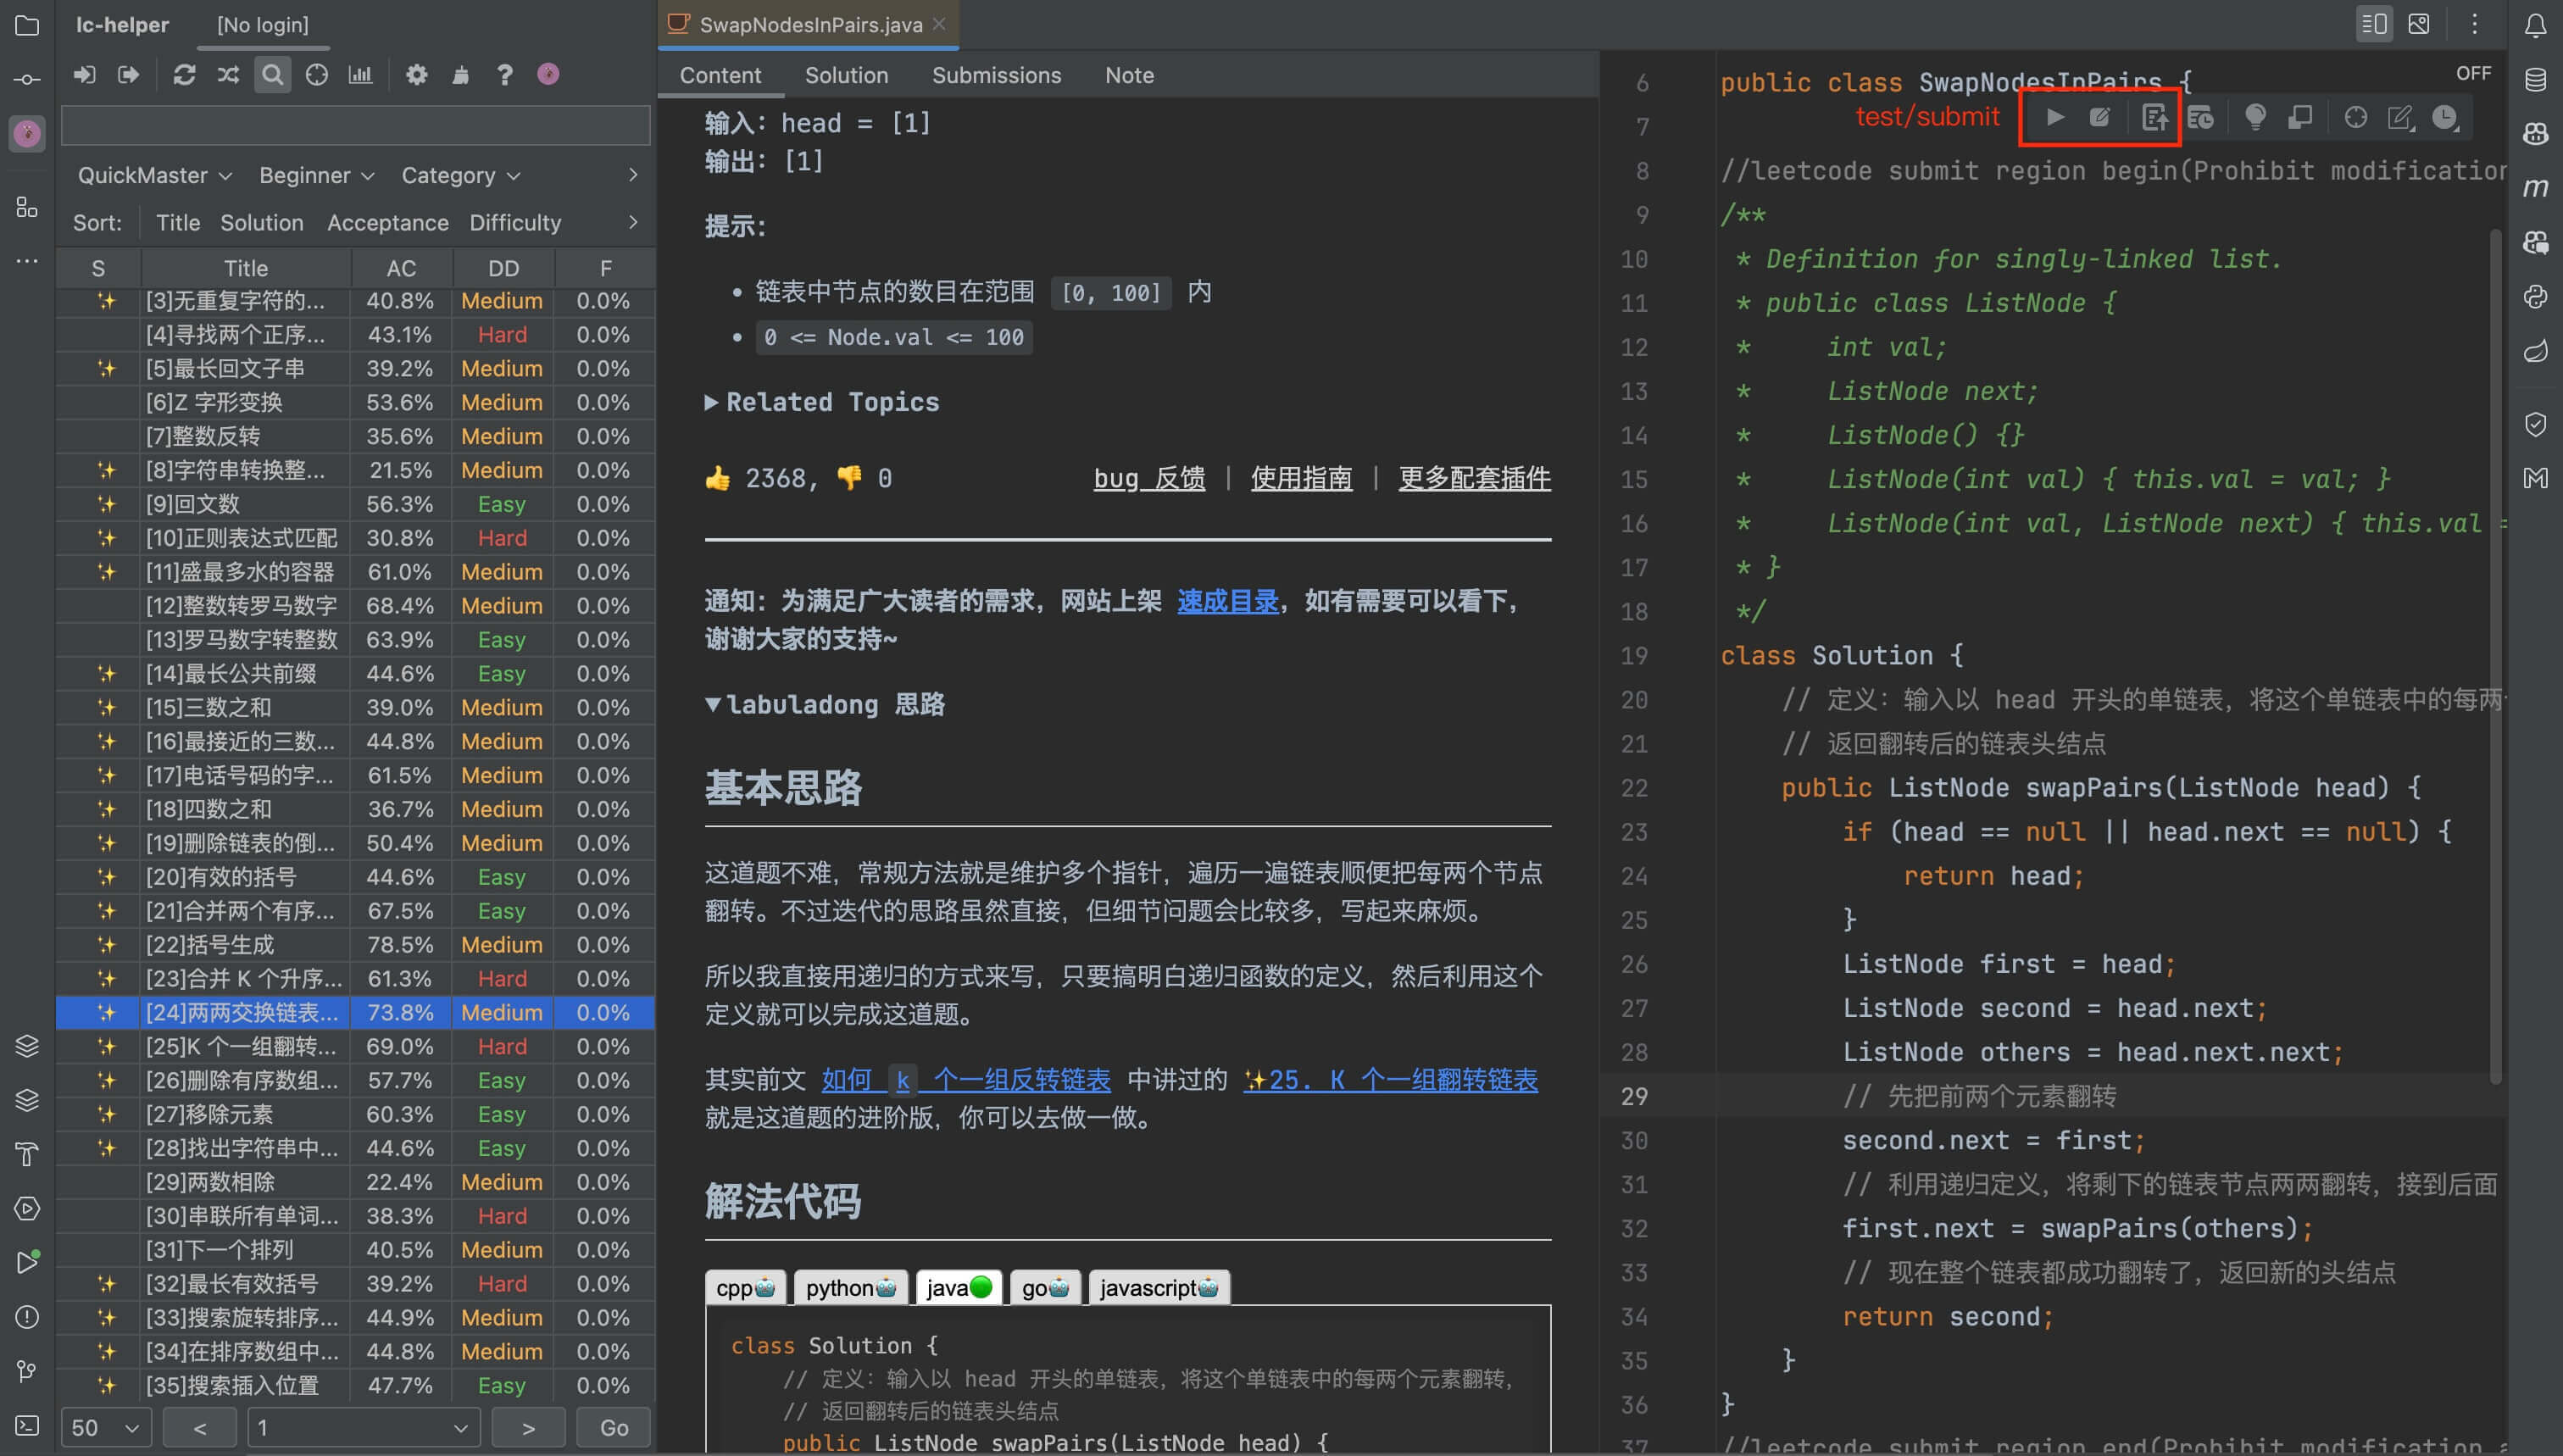
After logging in, you can start practicing problems. In the top right corner of the code editor, there is a floating icon. Click it to submit your code to LeetCode for testing and judging, just like on the website. If a problem has a solution or hints on this site, it will be marked with ✨. Click the problem to see "Solution" and "Hint" buttons, which show the site's ideas for solving the problem:
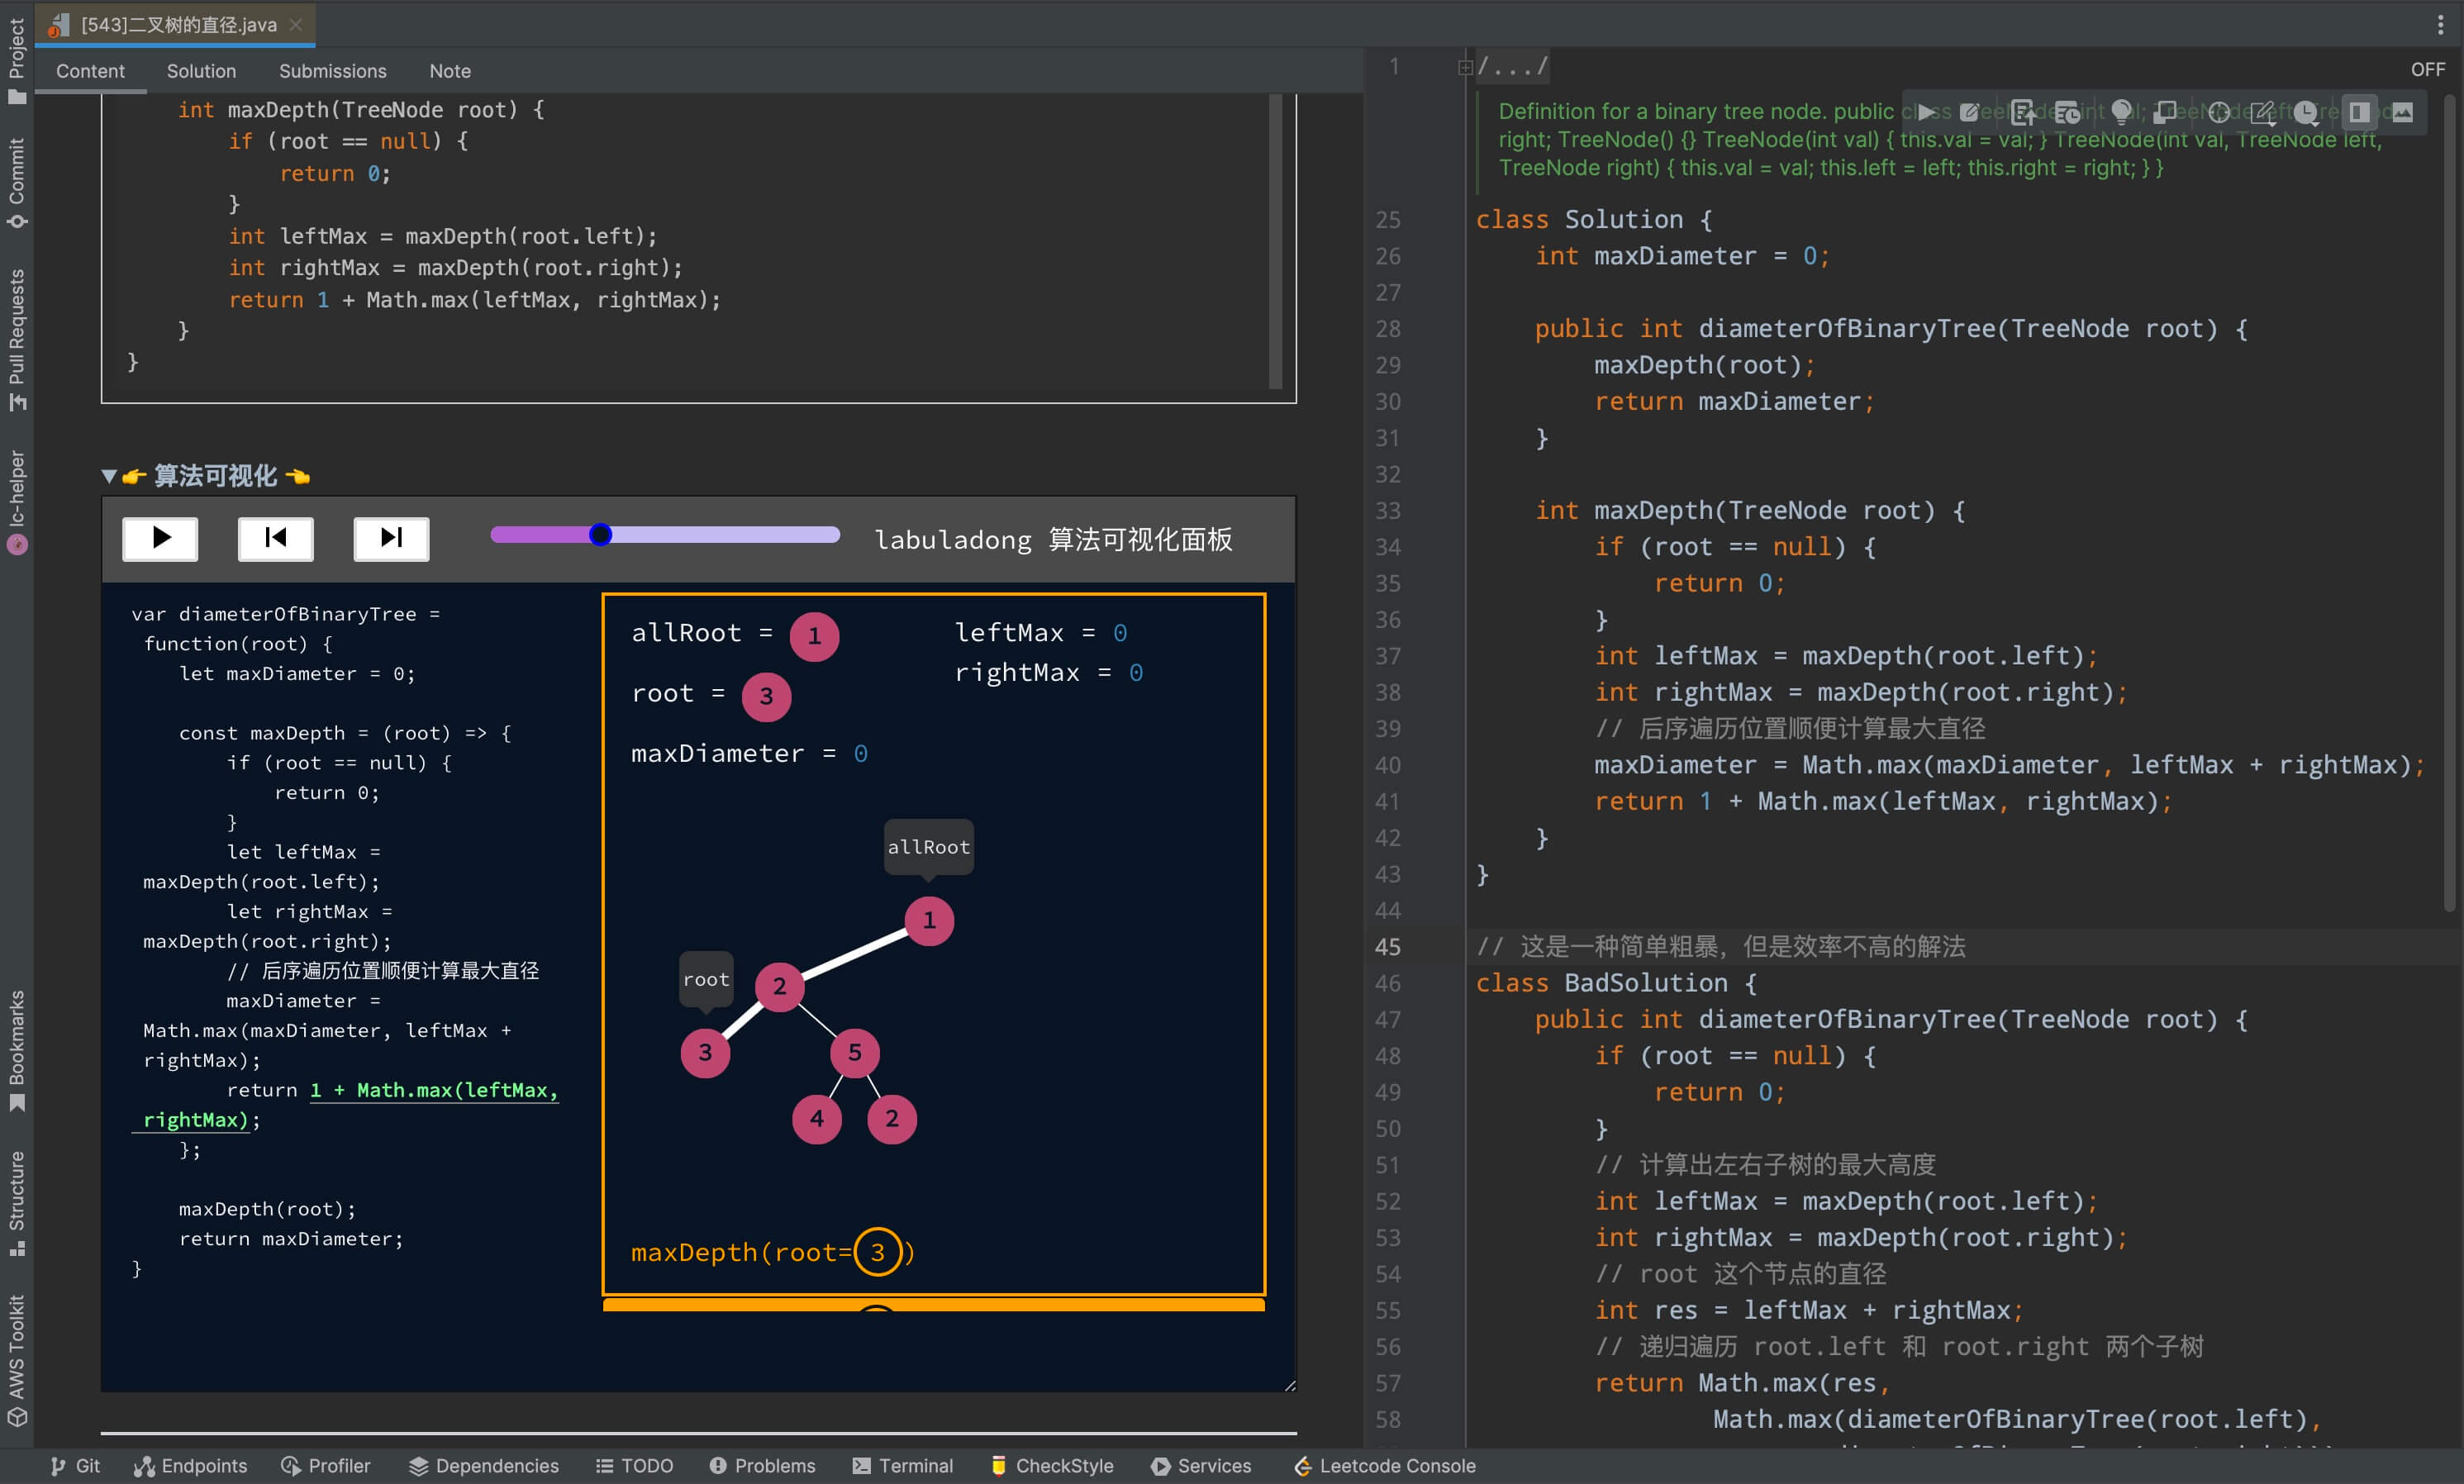
All features on this site are supported by the plugin, including image notes, algorithm visualization, and more:
Switch to English for International Users
By default, the solution/hint/visualization panels in the plugin are in Chinese. If you need English, go to the plugin settings and change the Language option to English.
Login to LeetCode
After installing the plugin, you will see a plugin icon in the sidebar. Click the plugin settings button and set up as shown below:
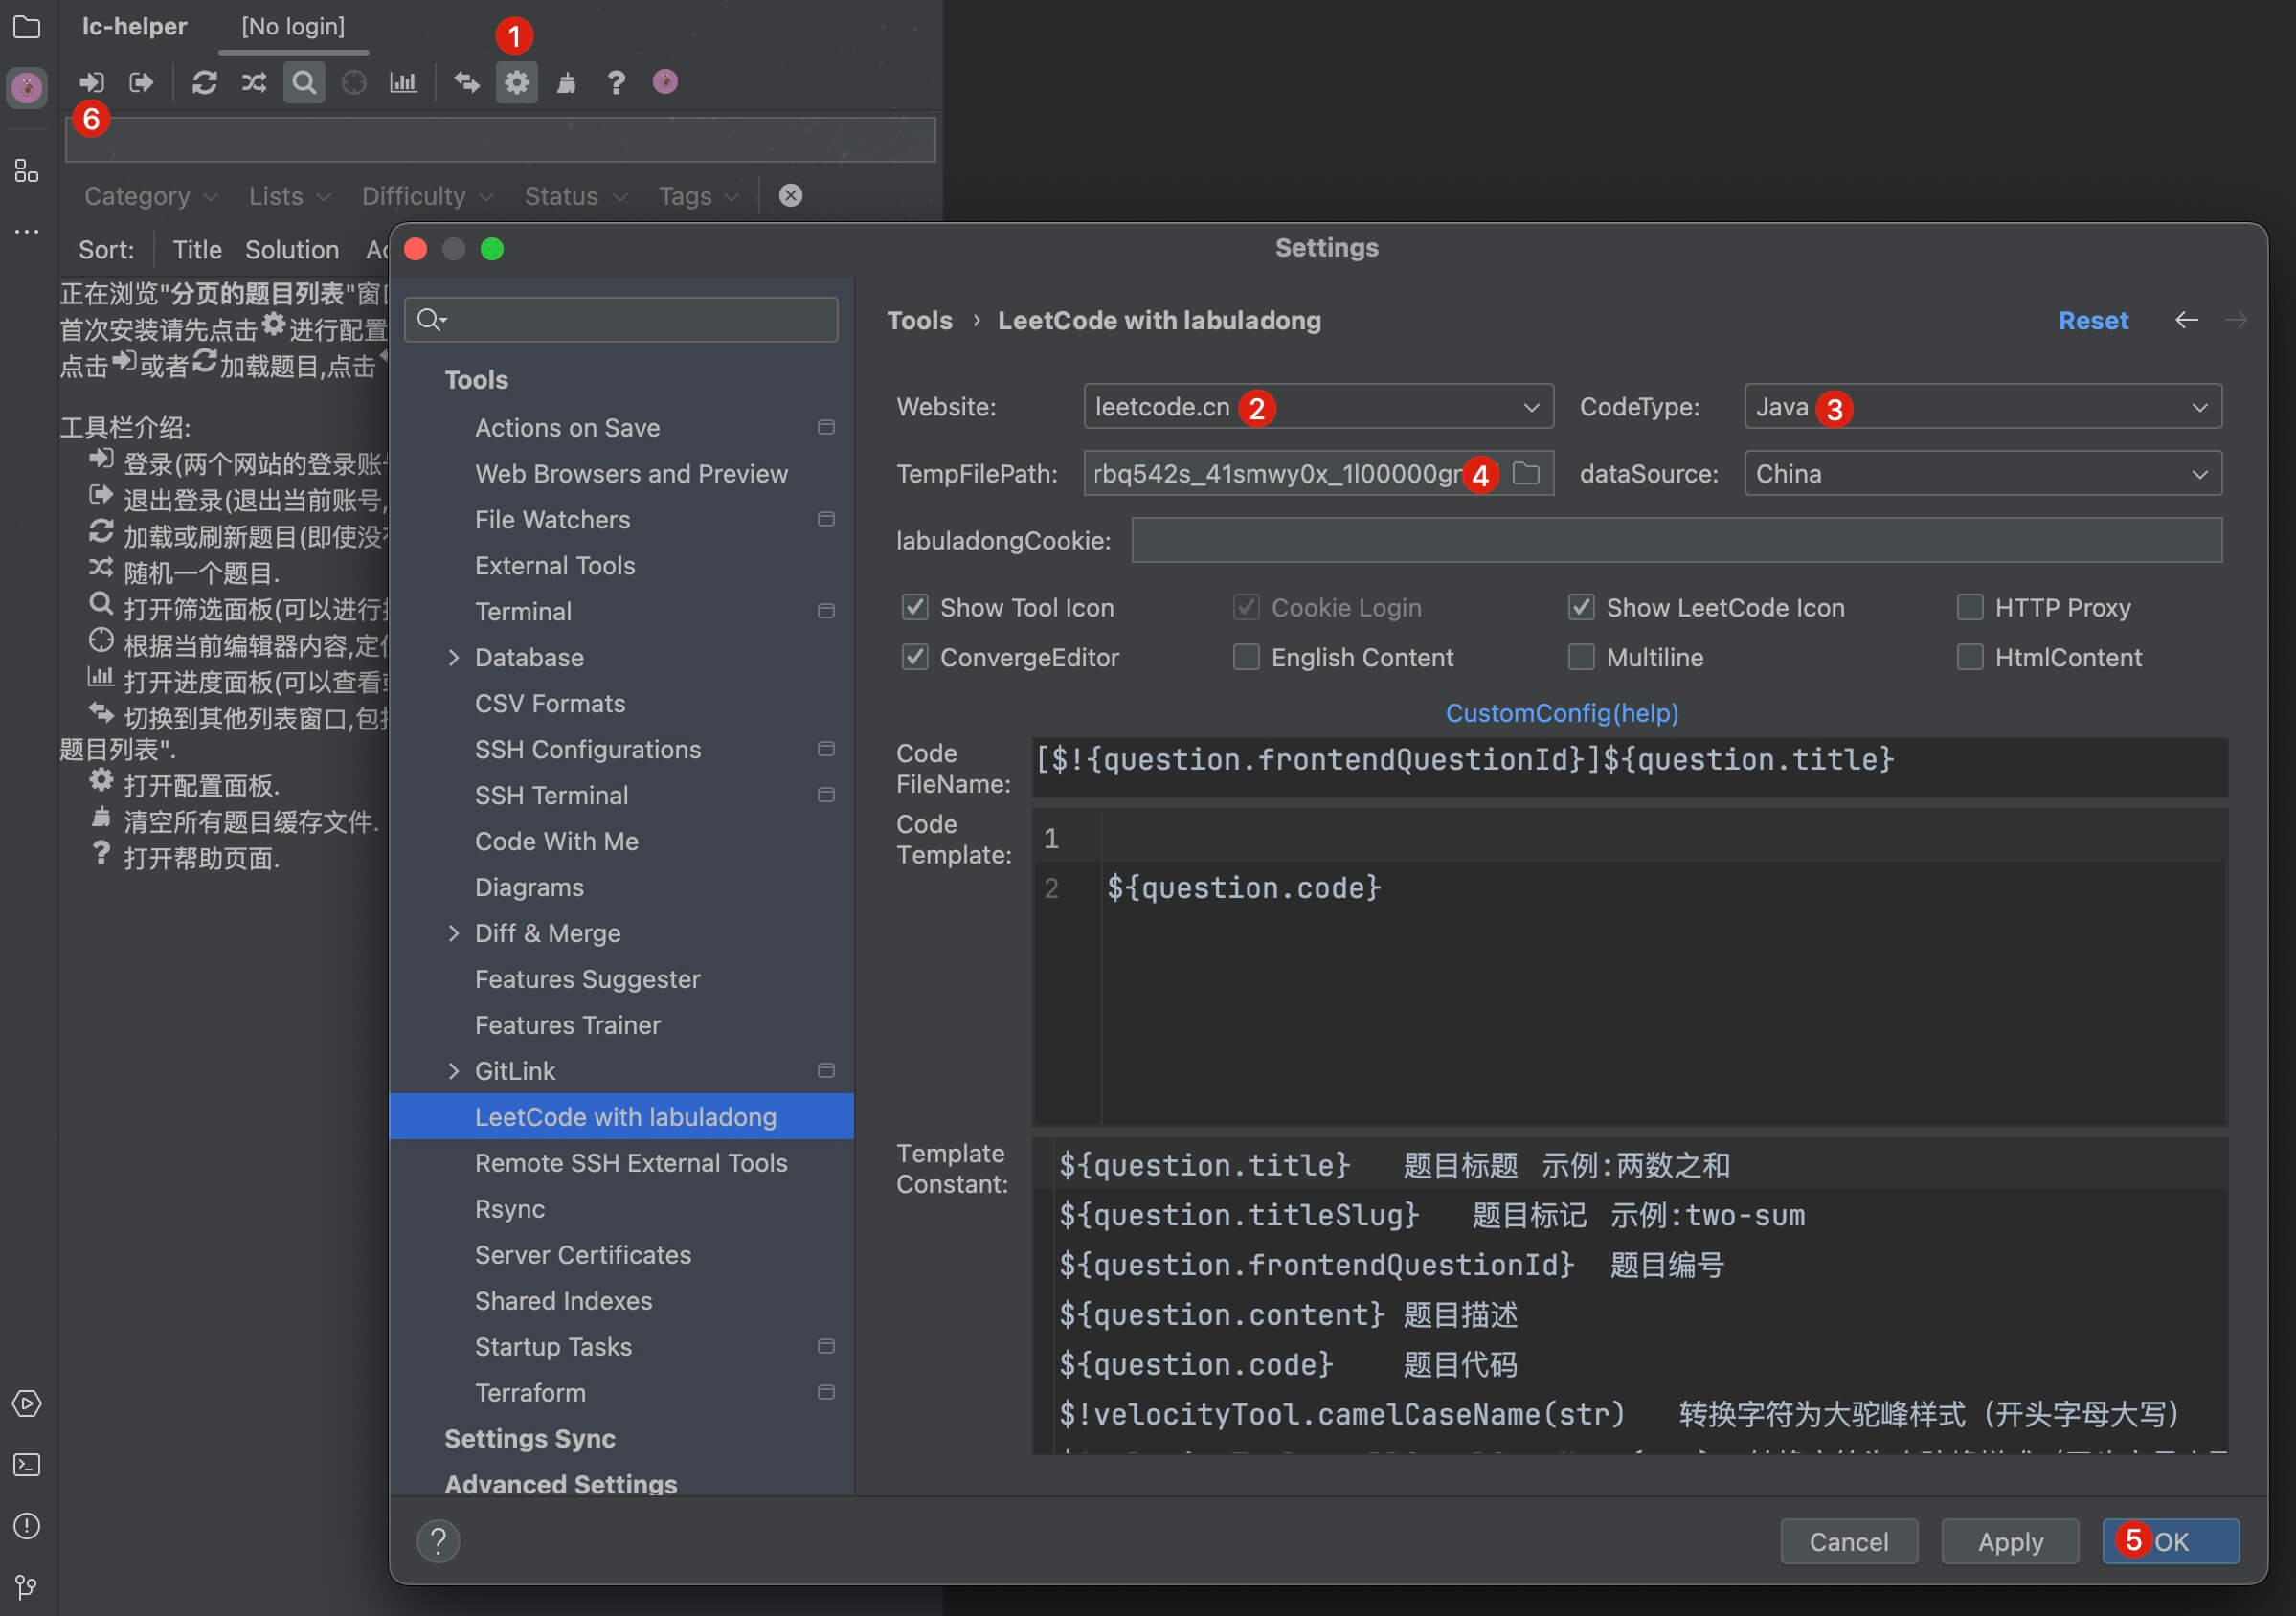
1️⃣ Click the settings button to open the settings page.
2️⃣ Choose the site you want to log in to, either LeetCode (English) or LeetCodeCN (Chinese).
3️⃣ Select your preferred programming language.
4️⃣ Set the folder path for saving your code files.
5️⃣ Click OK after finishing the setup.
6️⃣ Click the login button.
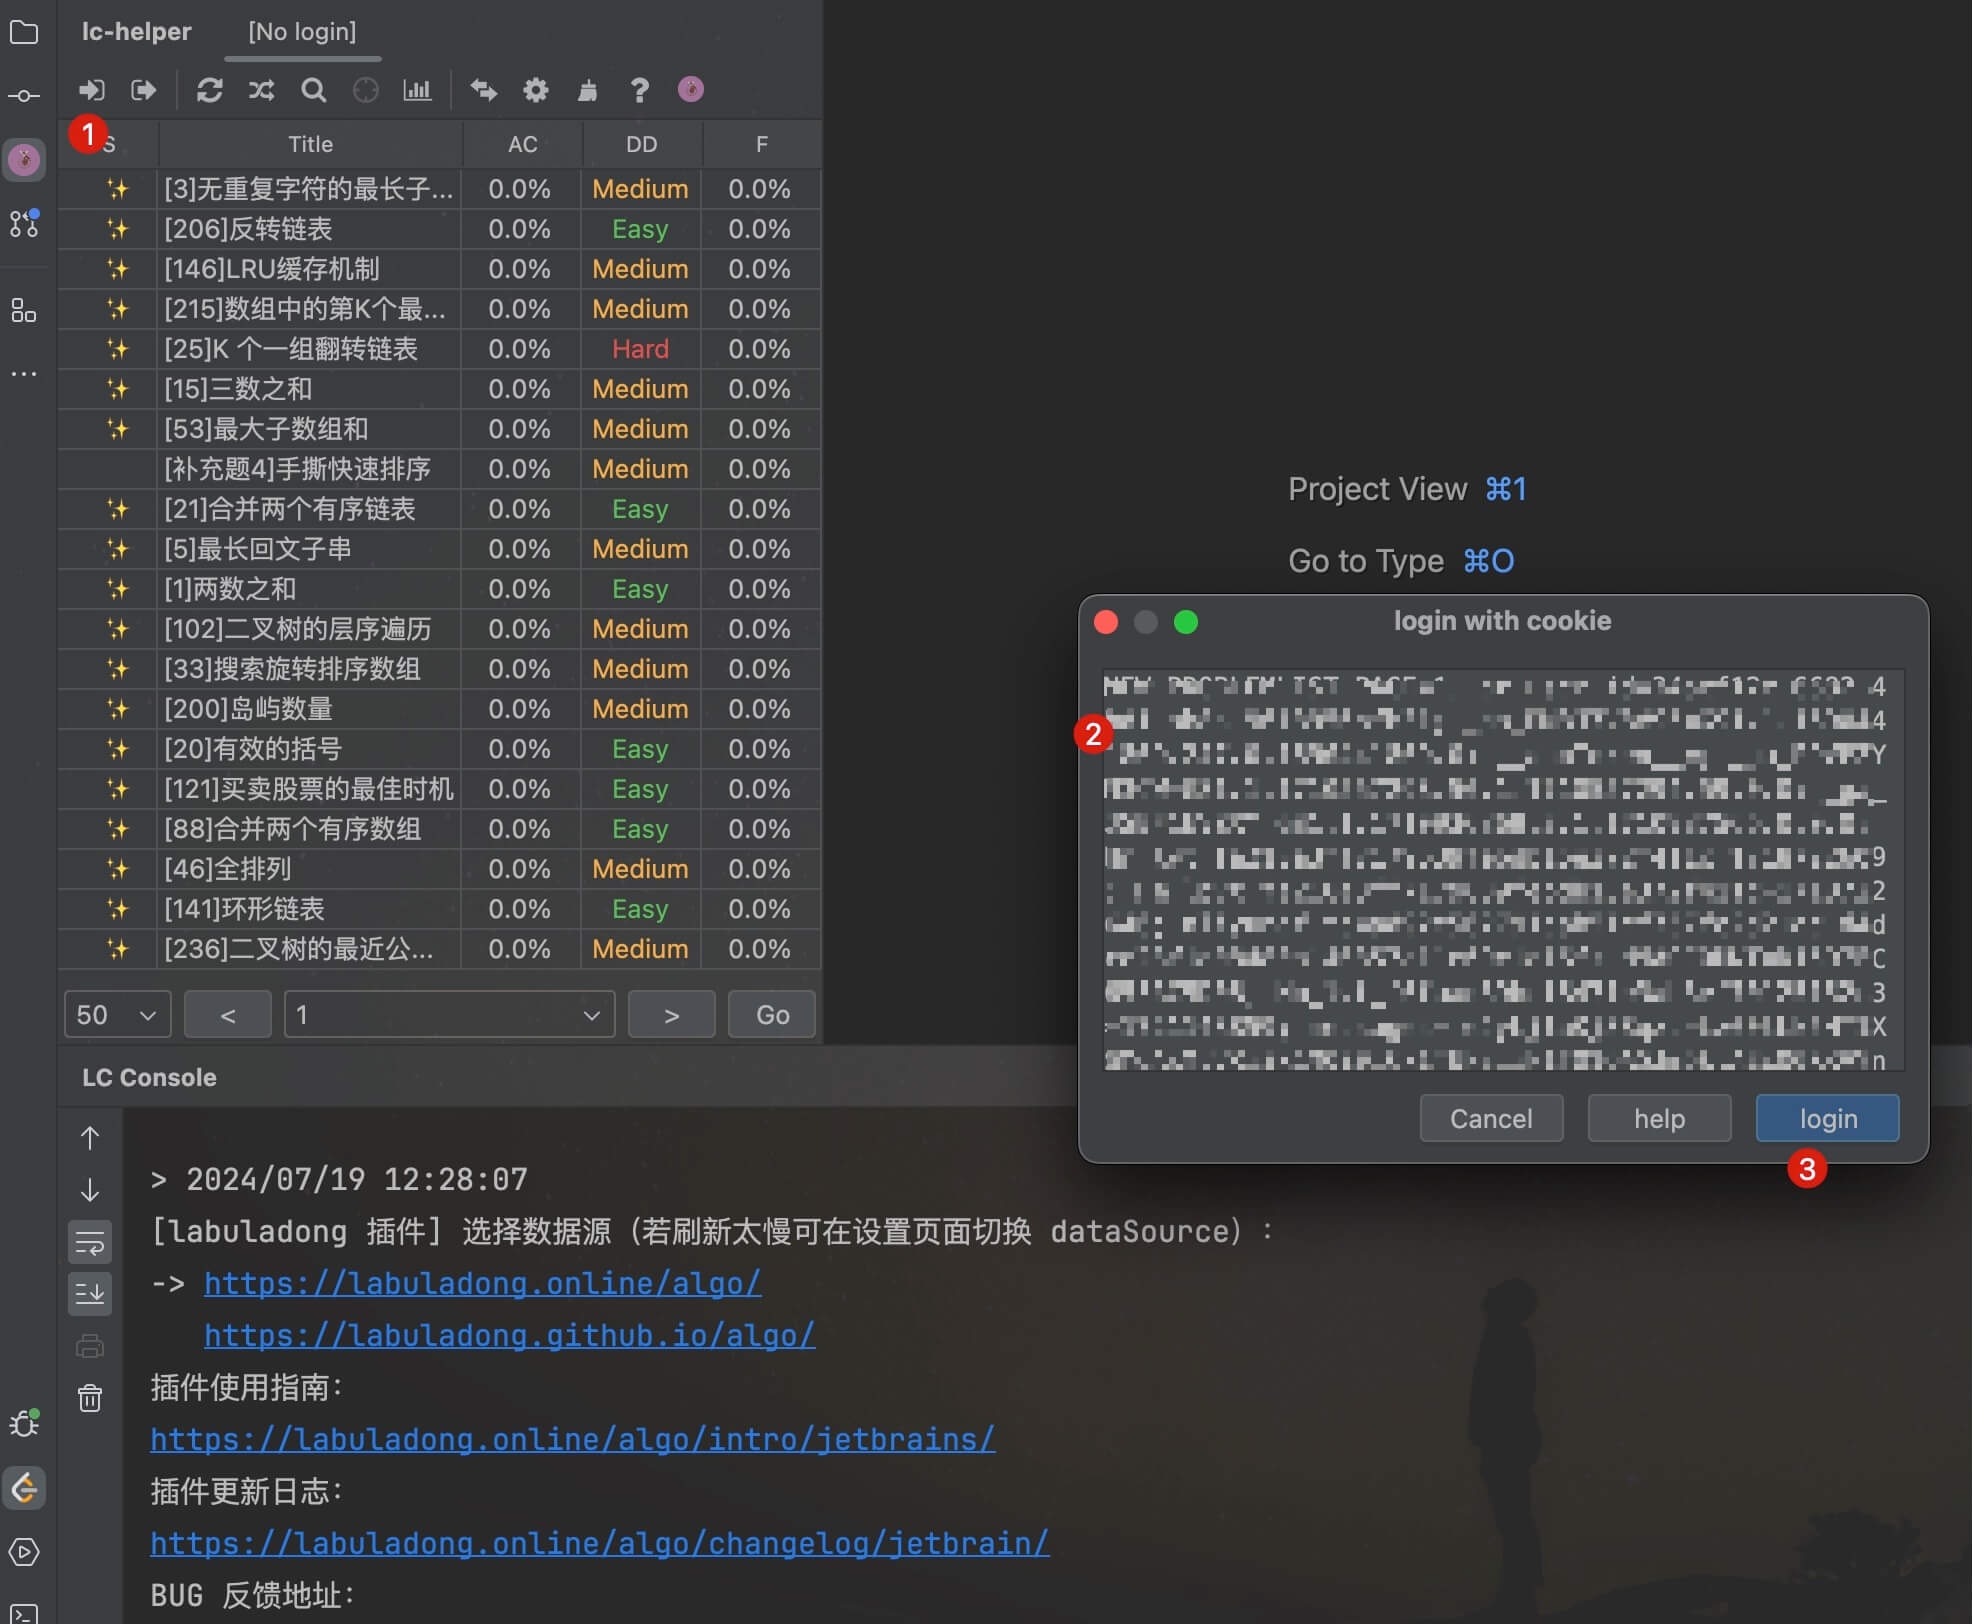
After clicking login, a dialog will pop up asking for a cookie. If you selected LeetCode (English), enter your cookie from leetcode.com. If you selected LeetCodeCN (Chinese), enter your cookie from leetcode.cn:
To get the cookie for leetcode.cn, open https://leetcode.cn in your browser and make sure you have logged in. Open Developer Tools (Press F12 in Chrome), and copy the cookie value:
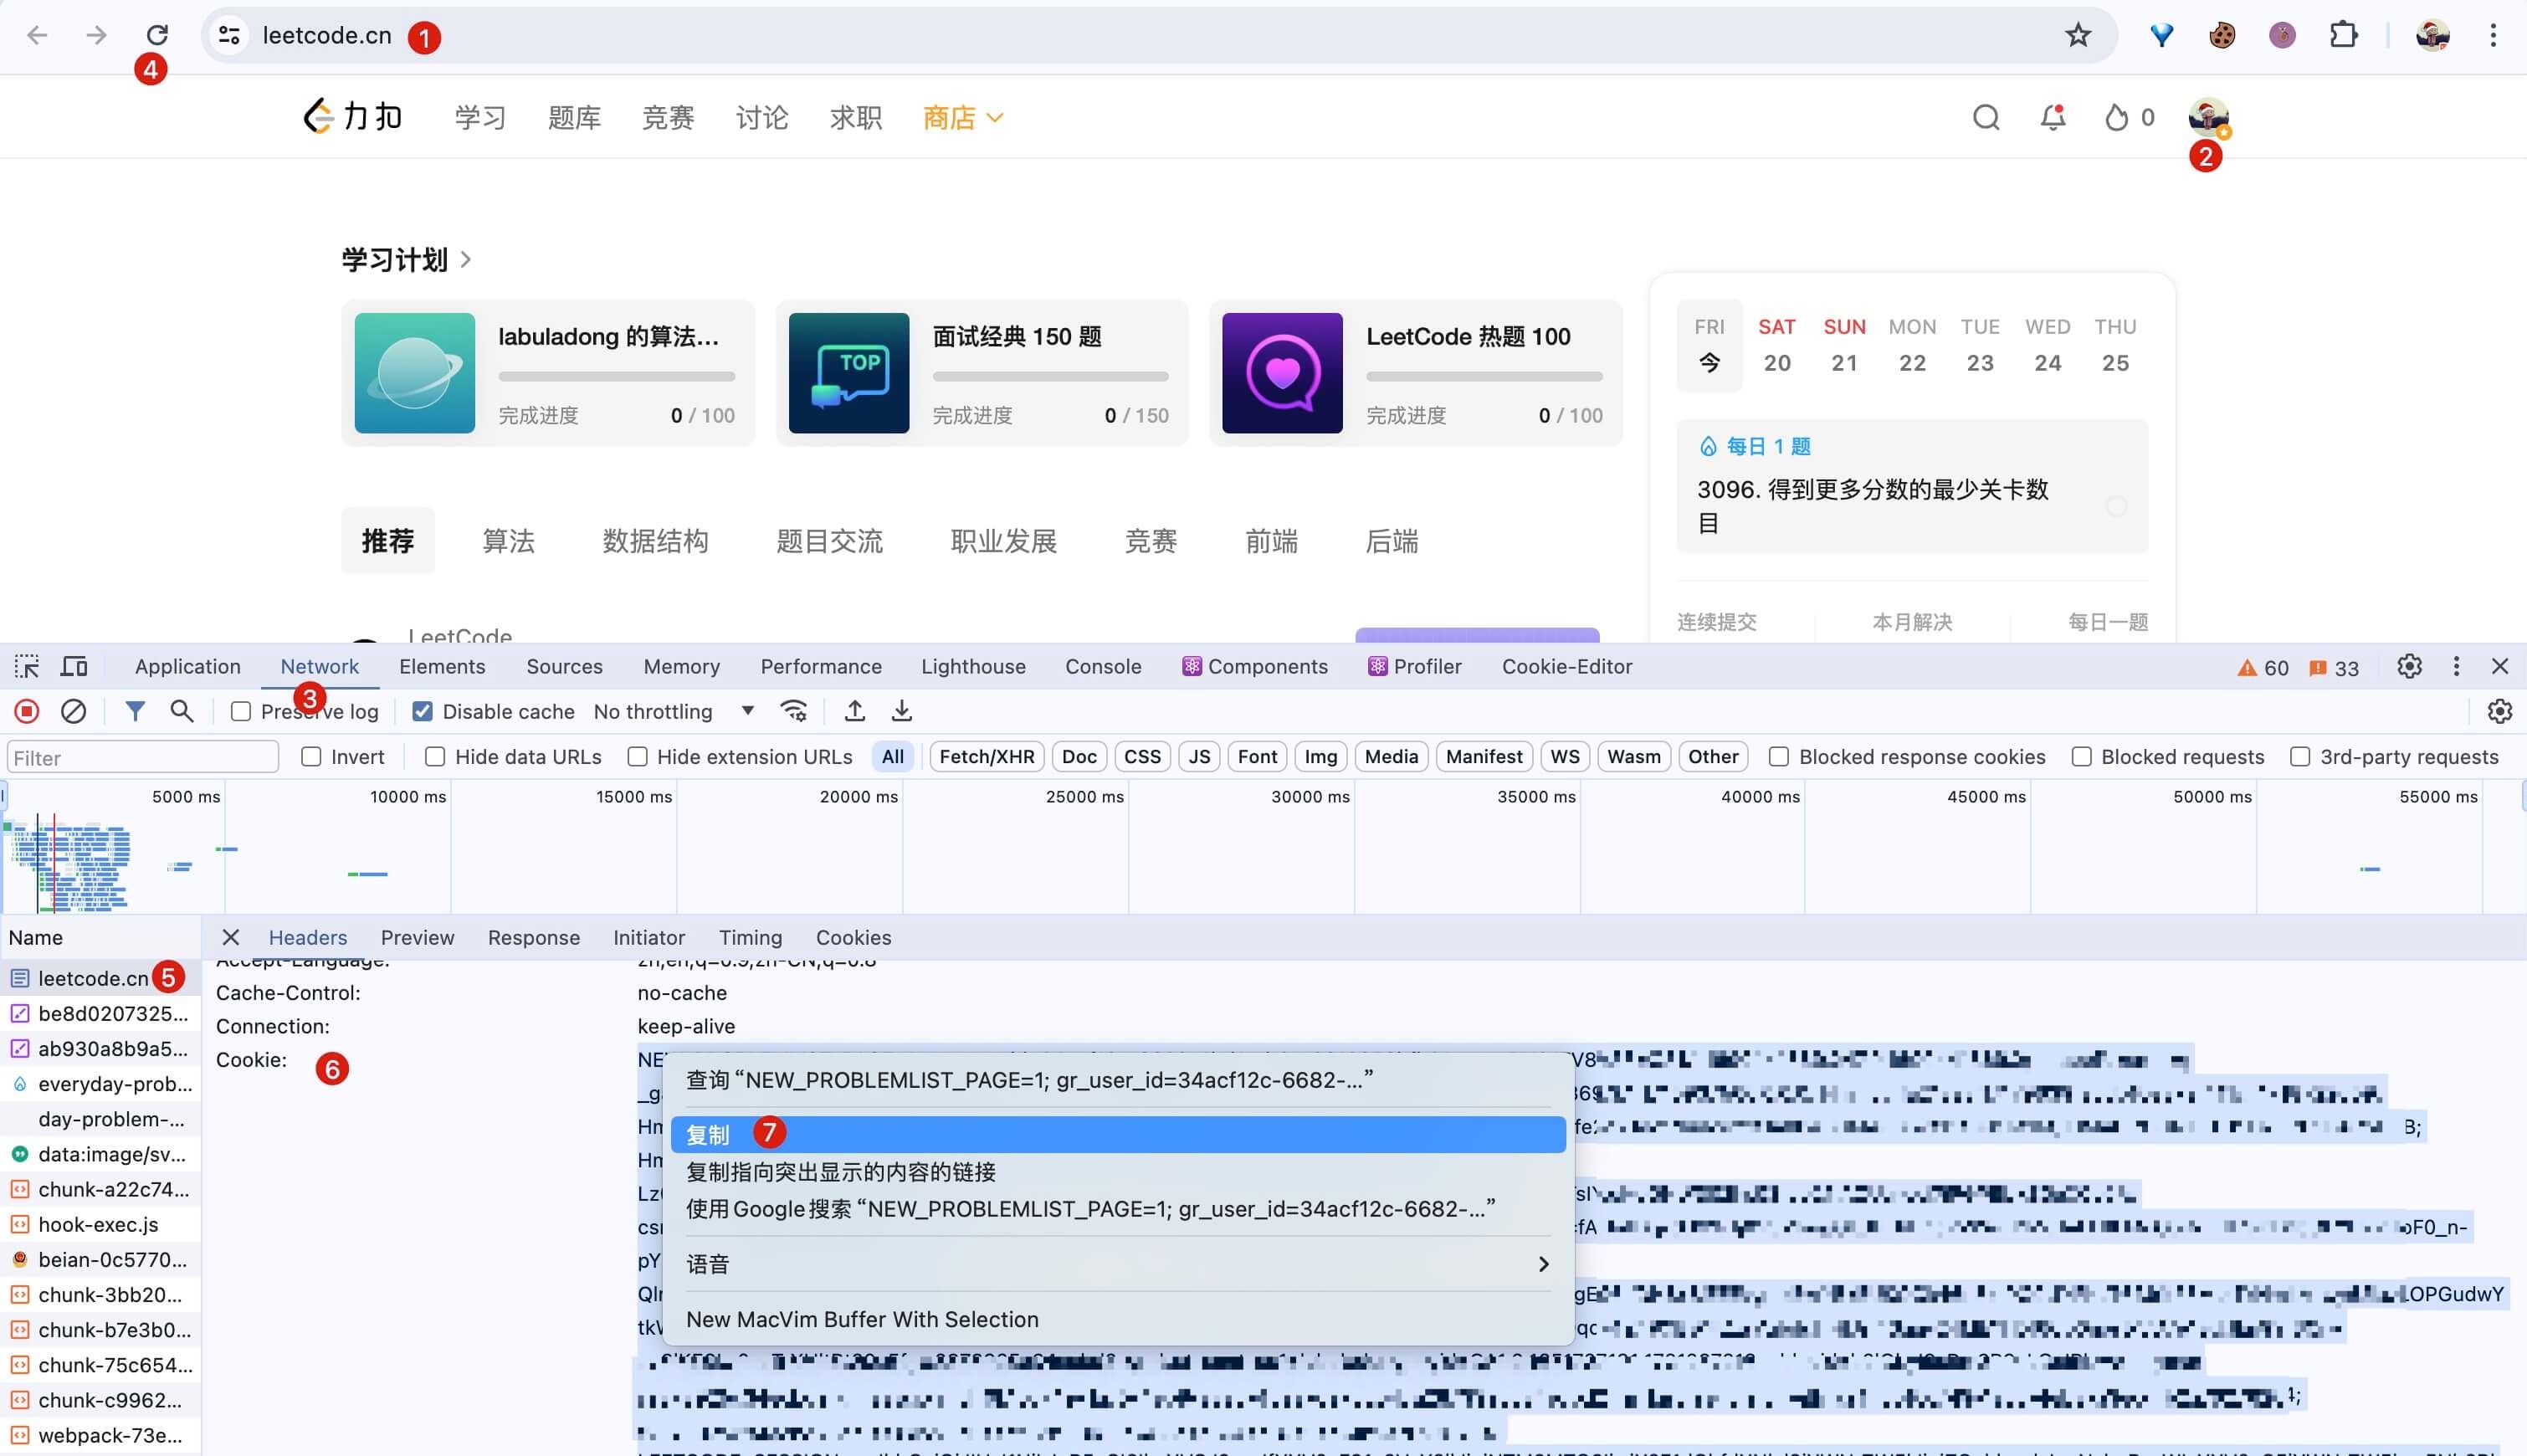
1️⃣ ~ 2️⃣ Open https://leetcode.cn and make sure you are logged in.
3️⃣ Open Developer Tools (F12 in Chrome), and click the Network tab.
4️⃣ ~ 6️⃣ Refresh the page, click the first request, and check the Headers. Find the Cookie field.
7️⃣ Select the whole cookie string and right-click to copy.
The steps are similar for getting the cookie from leetcode.com. Just open https://leetcode.com and repeat the steps above.
Paste the cookie into the plugin and click login. You should now be able to log in to your LeetCode account in the plugin and start practicing problems.
Unlocking Solution Ideas and Problem Lists on This Site (Optional)
Note
All users can use the problem-solving features of the plugin and access some solution ideas for free. To unlock all the solution explanations, algorithm visualizations, and problem lists on the plugin, you need to subscribe to this site.
If you have already subscribed, please follow the steps below to unlock all solutions and ideas in the plugin.
Step 1: Install and Start the Plugin
Install the plugin as described above and log in with your LeetCode account. Make sure the plugin is working properly.
Step 2: Get the Site Cookie
Click the copy button below to get the cookie needed for plugin login:
Step 3: Manually Refresh Data
After copying the cookie, follow the steps shown in the image below:
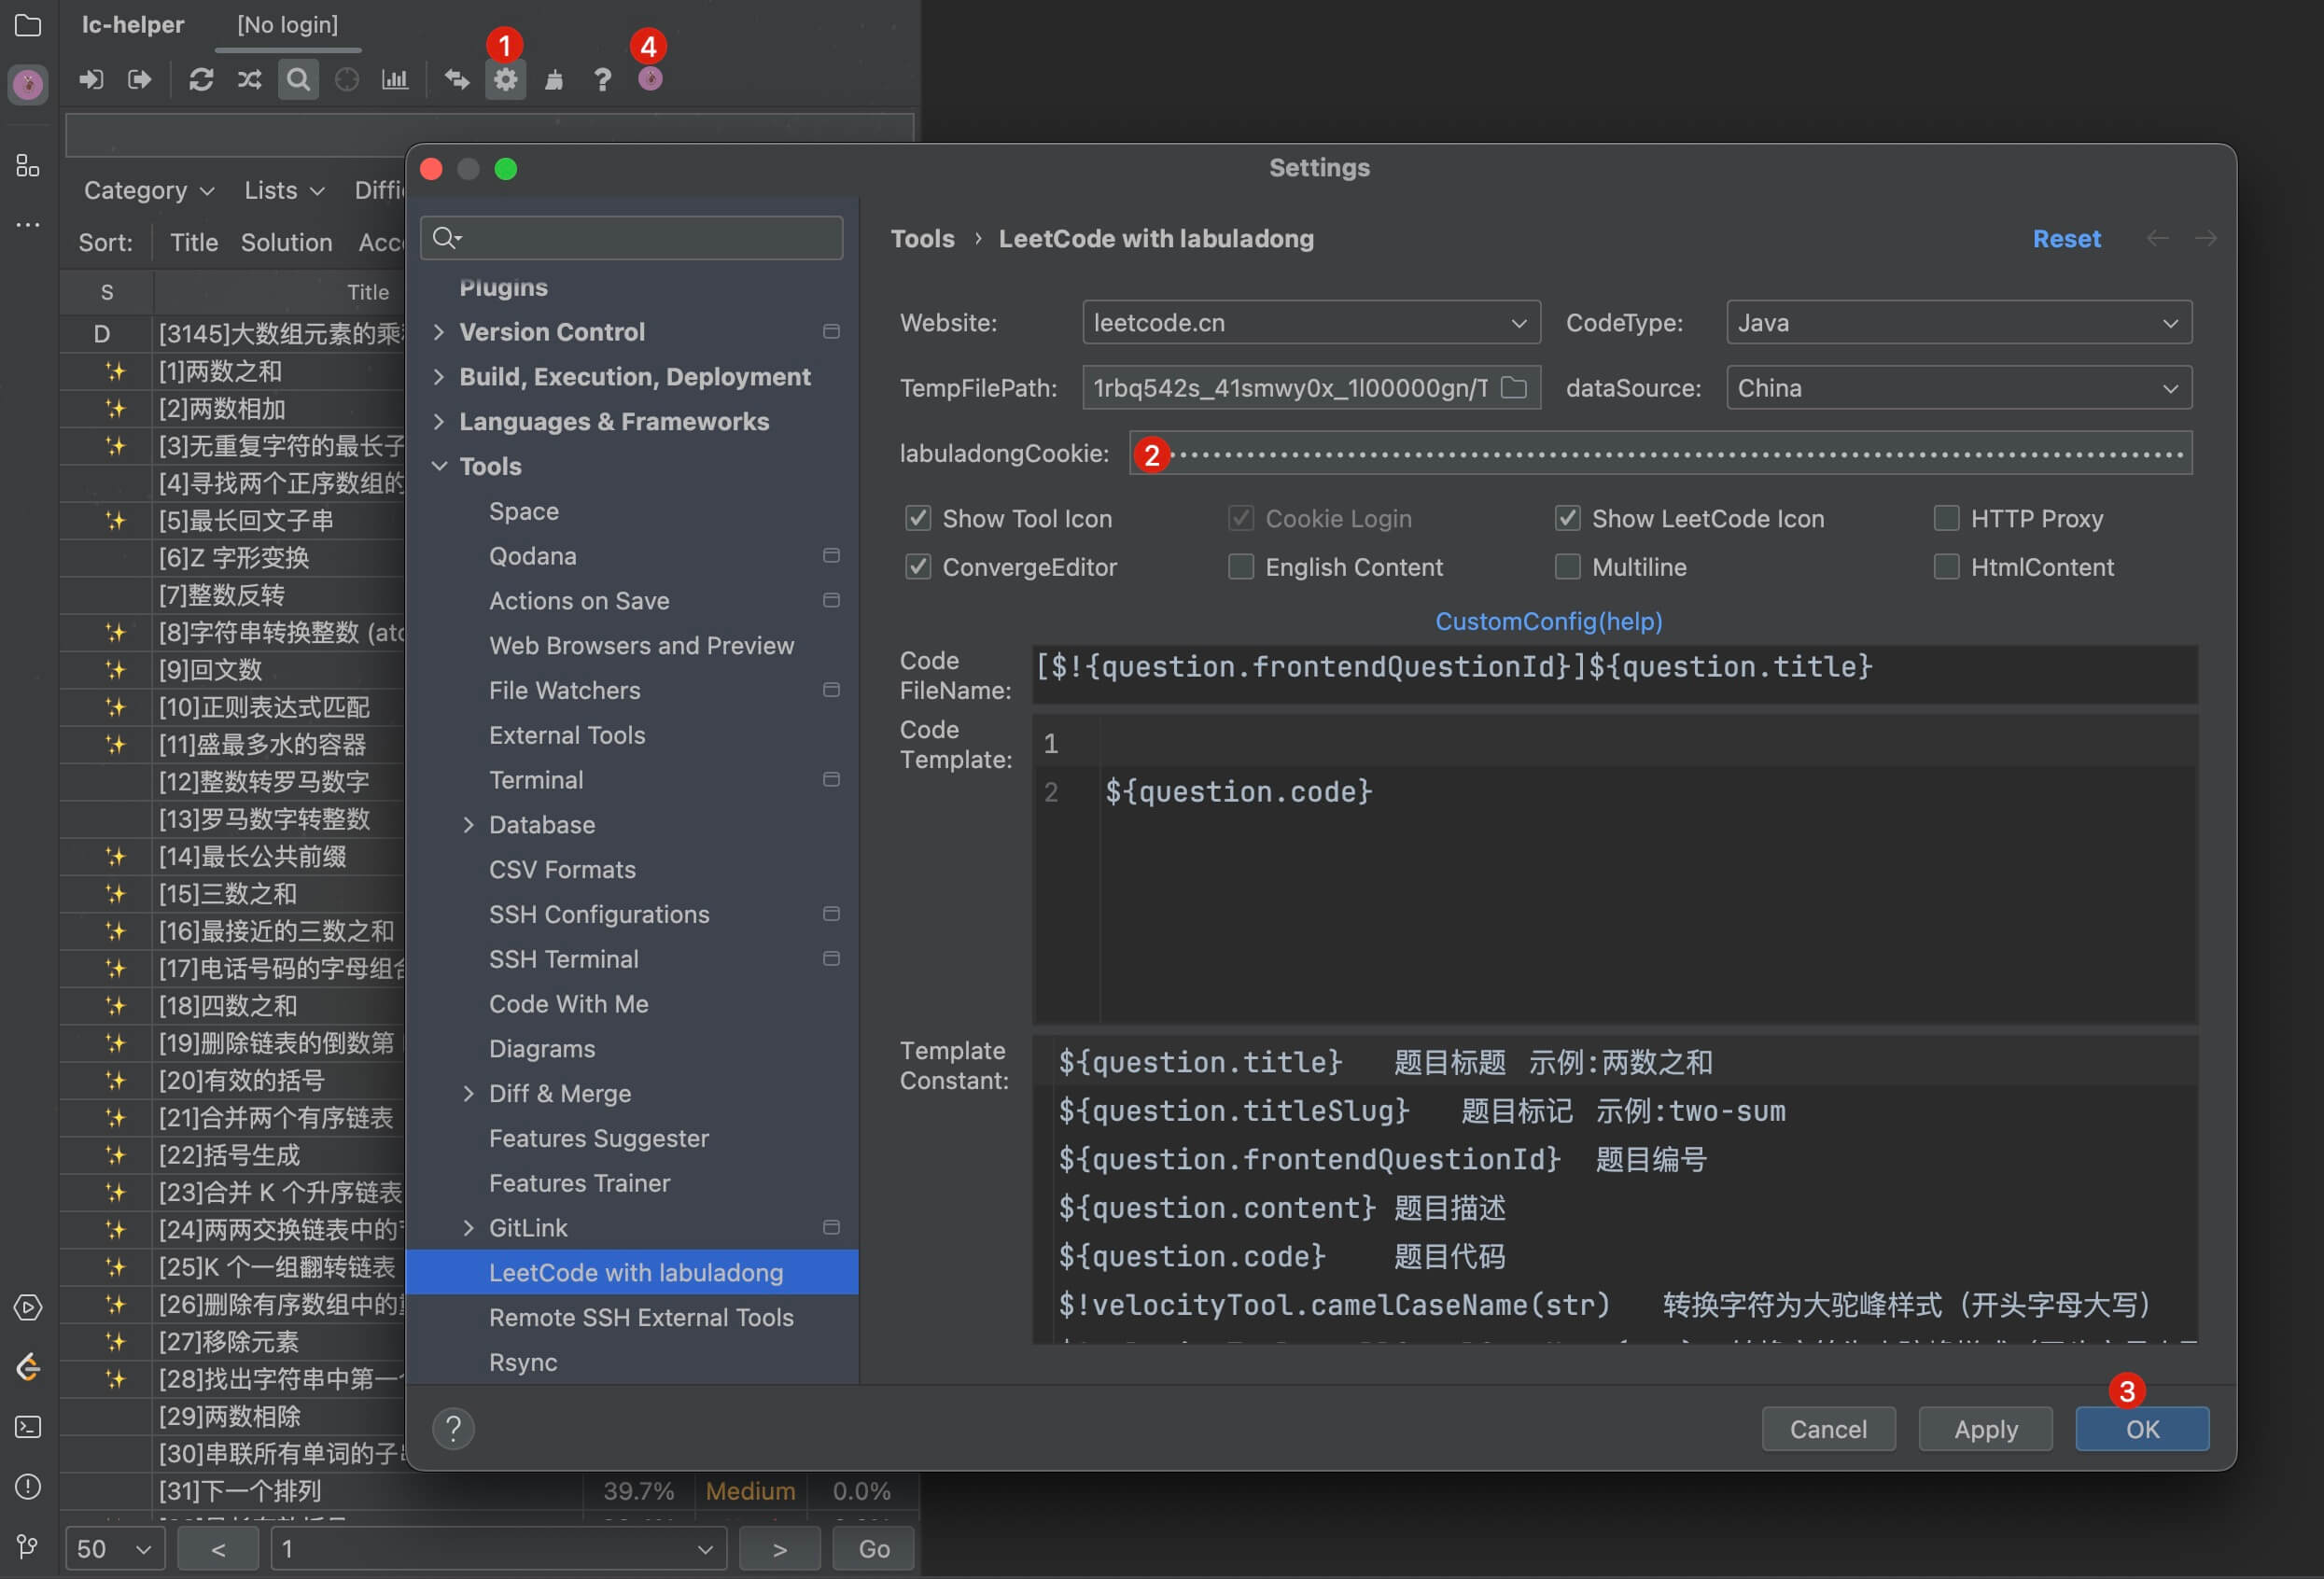
1️⃣ Click the settings icon to enter the settings page.
2️⃣ Paste the cookie into the input box.
3️⃣ Click the OK button.
4️⃣ Click the labuladong website icon to manually trigger data fetching.
The plugin will first fetch public data, then fetch exclusive solution data for subscribers. If data fetching is slow, try disabling all network proxies or switching networks.
You should see output similar to the following:
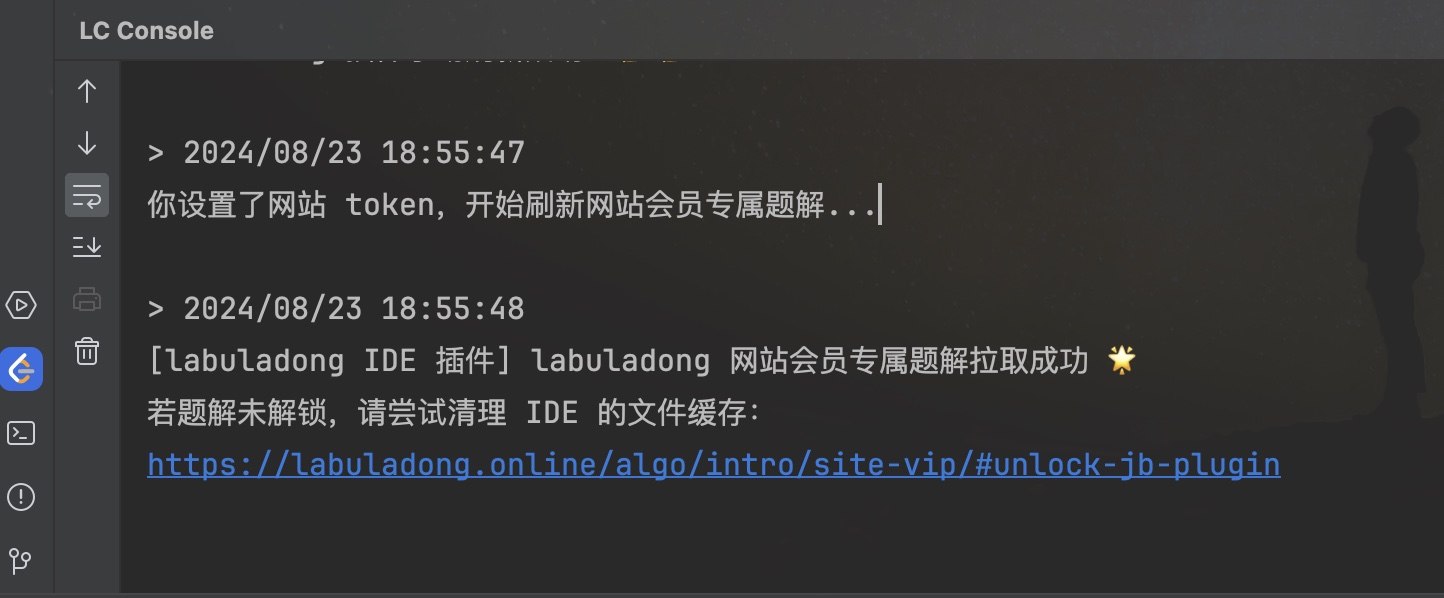
If you do not see this output, there may be a network issue. Try disabling system proxy or switching networks.
Step 4: Clear IDE File Cache
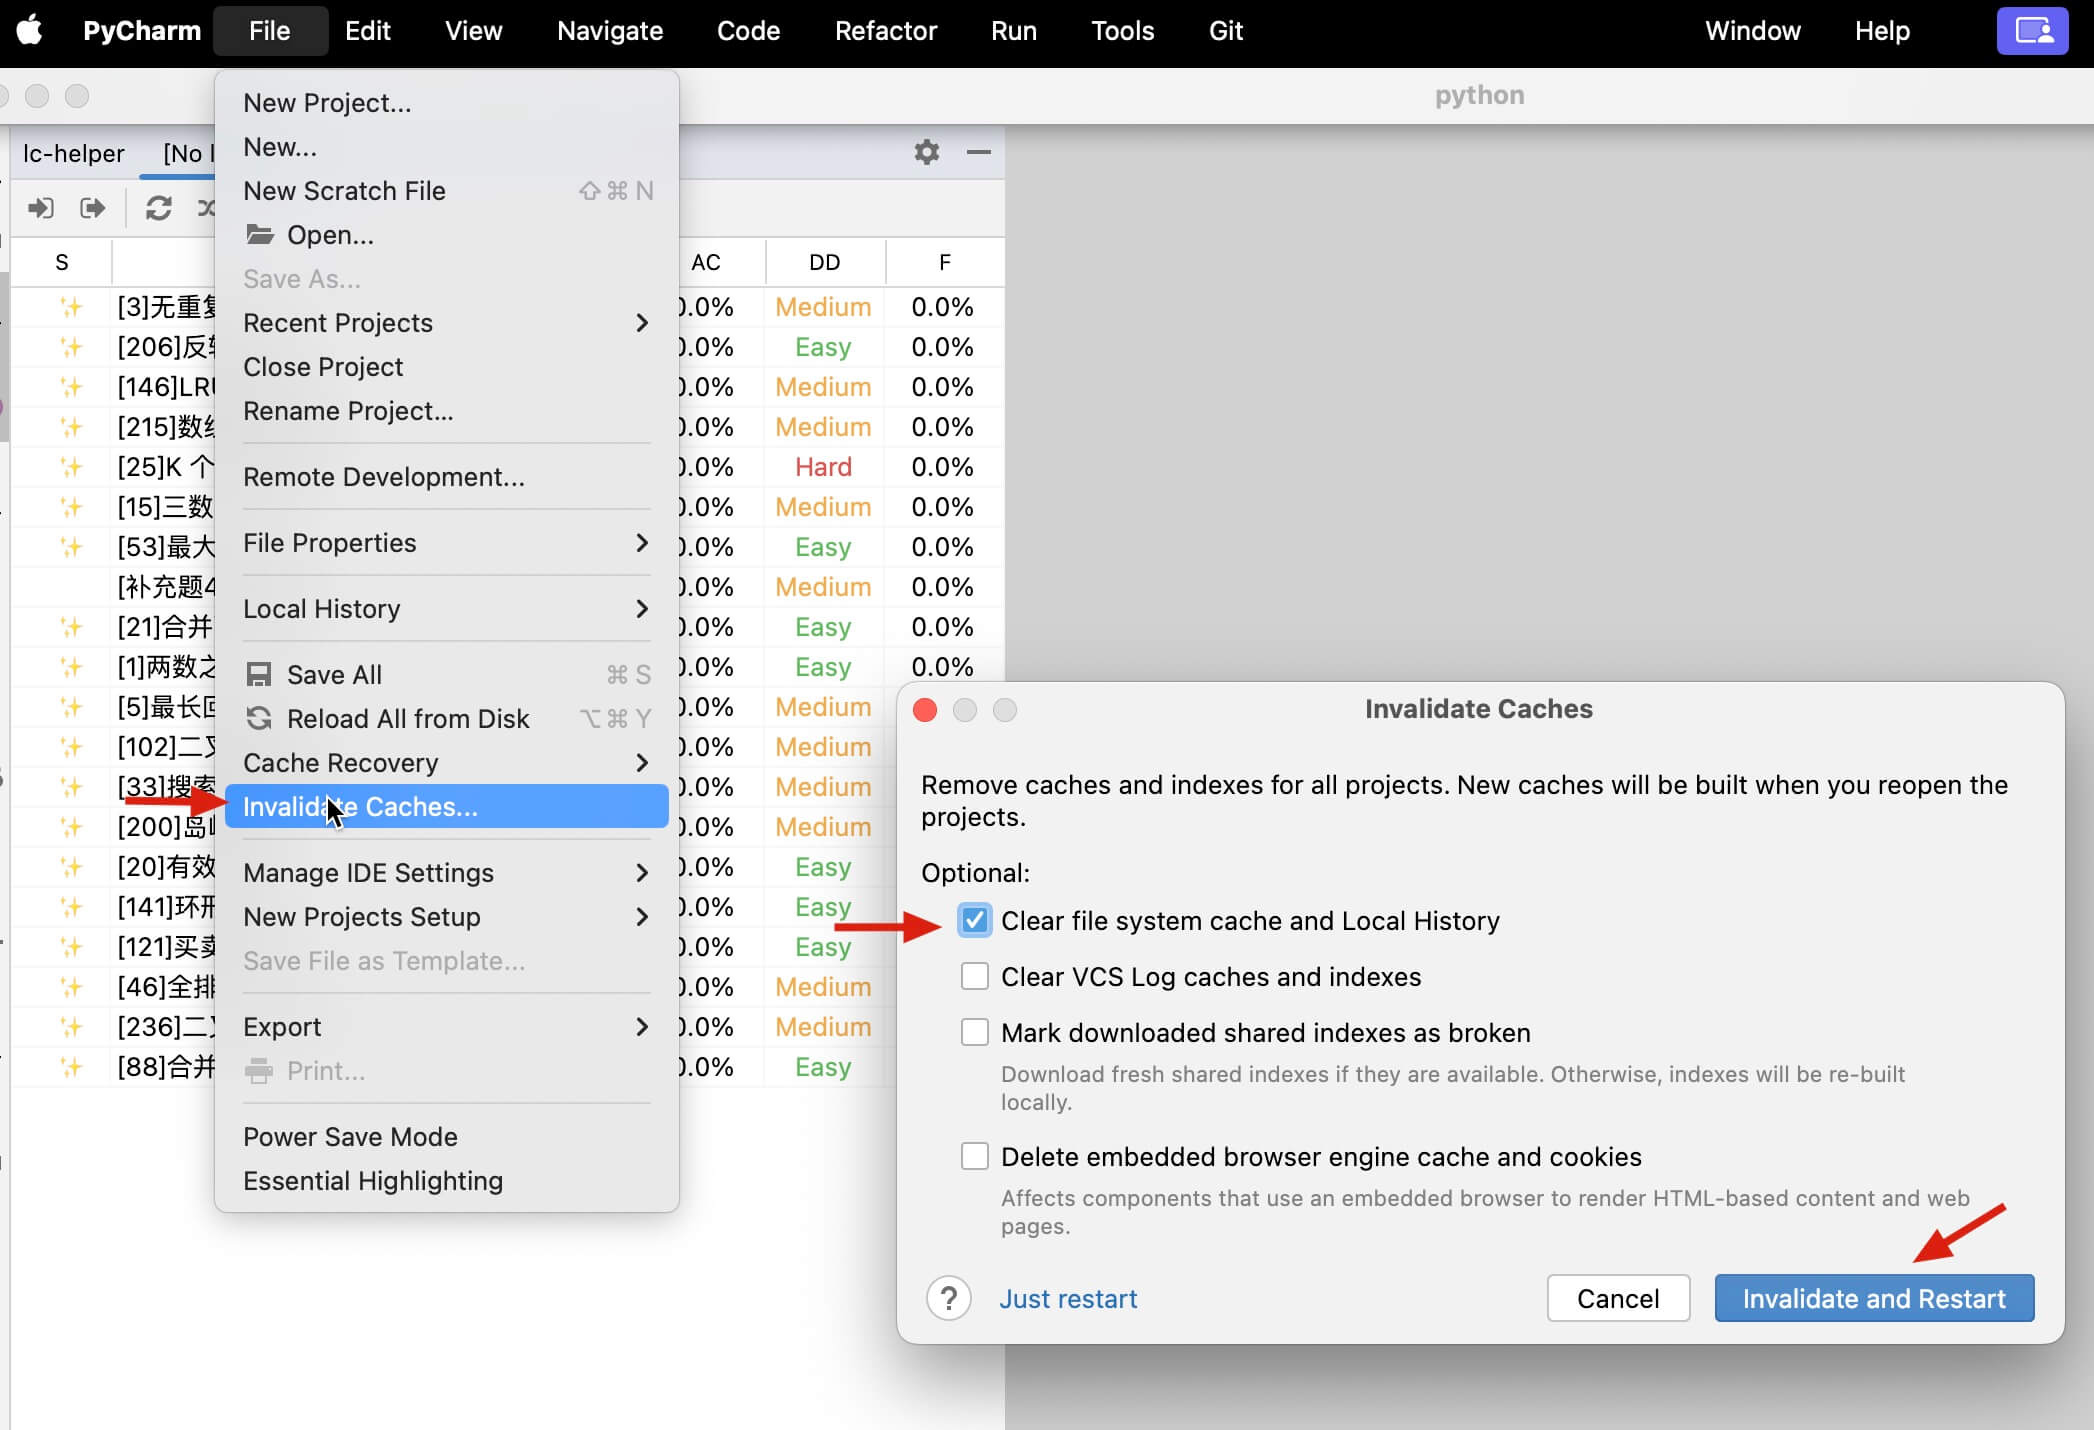
If the data was fetched successfully, you should be able to view all solution explanations in the plugin. However, due to caching, questions you opened previously may still appear locked. This is because the IDE's file system cache has not been refreshed.
Please close all opened question files first, then manually clear the IDE cache and restart the IDE as shown below:
Local Debugging of Algorithm Code (Optional)
Note
This part is optional. It is for readers who want to set breakpoints and debug code locally:
If you do not set up local debugging, it works just like practicing on the LeetCode website. Your code will be submitted to the LeetCode API for testing and judging (your IDE may show type errors, but this does not affect submission, you can ignore these):
Local debugging depends on your local development environment, not the plugin itself. If you still get errors after following this guide, please check the error messages yourself.
The code for each problem is just a normal code file. In theory, you can debug and run it locally, but there are a few issues:
LeetCode uses some built-in types like
ListNodeandTreeNode, and the test case inputs are arrays. You need to implement these structures yourself and convert the input data.You may need extra configuration for each programming language so that your code editor can recognize the project. Otherwise, you may not be able to run code locally or use auto-completion.
To solve these problems, I have made a solution. If you follow the steps below to set up the plugin, you can run LeetCode problem code locally. Java, C++, Python, Golang, and JavaScript are supported.
Step 1: Open the Corresponding Folder in Your IDE
I have uploaded a prepared project template to Github. You can clone it to your computer:
git clone https://github.com/labuladong/lc-plugin-template.git

# For users in China, you can download from Gitee:
git clone https://gitee.com/labuladong/lc-plugin-template.git
If you find any problems or have suggestions, feel free to send a PR or open an Issue.
This template has folders for different programming languages:
- Java:
java-template - C++:
cpp-template - Python:
python-template - Golang:
go-template - JavaScript:
js-template
Open the folder for your programming language in your IDE.
Step 2: Set Up for Different Languages
Click the gear icon to open the plugin settings page. There are a few settings you need to configure for your chosen language:
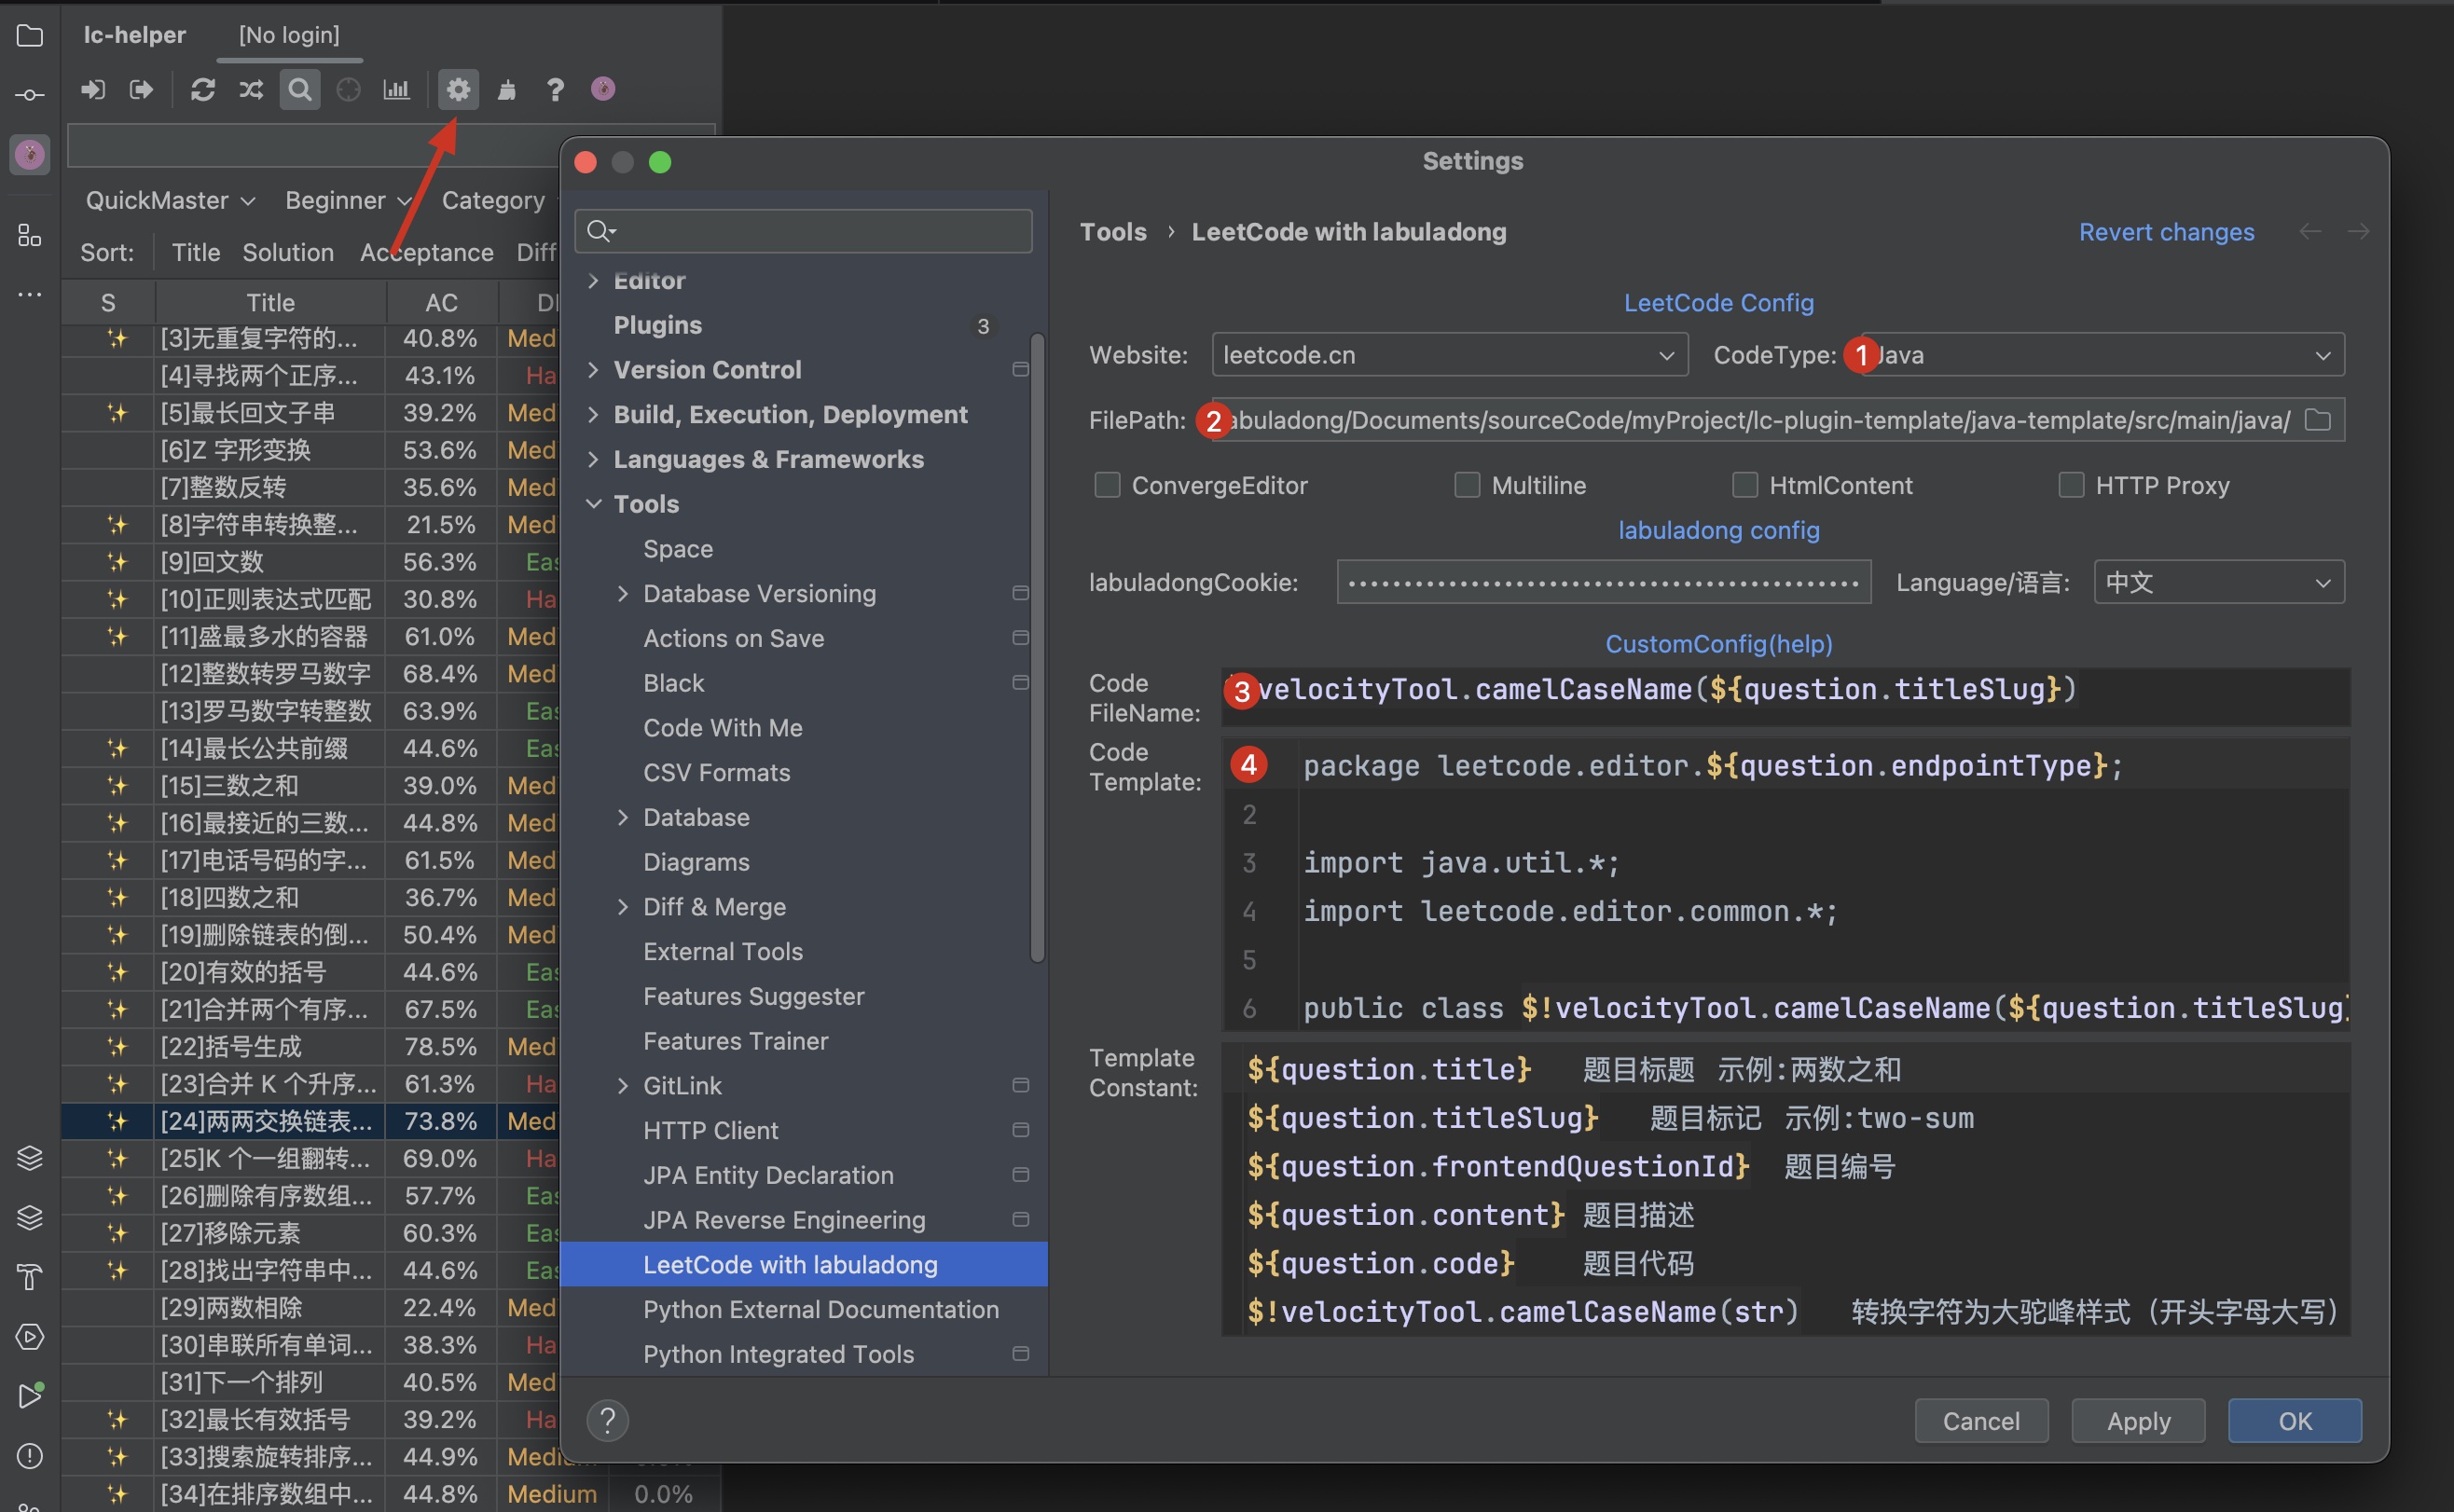
CodeType: The programming language you use.FilePath: The path where your code files are stored.Code Filename: The name of the code file.CodeTemplate: The code template, which can add package names,mainfunction, and so on.
Below, I explain the setup for each language. /<your>/<path>/<to>/lc-plugin-template/ means the path where you cloned the lc-plugin-template folder.
Note
On Windows computers, the path separator is \ instead of /. The path to the lc-plugin-template folder looks like this:
C:\<your>\<path>\<to>\lc-plugin-template\Please adjust according to your computer.
Java
Jetbrains IDE:Intellij IDEA
CodeType:Java
FilePath:
/<your>/<path>/<to>/lc-plugin-template/java-template/src/main/javaCodeFilename:
$!velocityTool.camelCaseName(${question.titleSlug})CodeTemplate:
package leetcode.editor.${question.endpointType};
import java.util.*;
import leetcode.editor.common.*;
public class $!velocityTool.camelCaseName(${question.titleSlug}) {
${question.codeWithIndent(4)}
public static void main(String[] args) {
Solution solution = new $!velocityTool.camelCaseName(${question.titleSlug})().new Solution();
// put your test code here
}
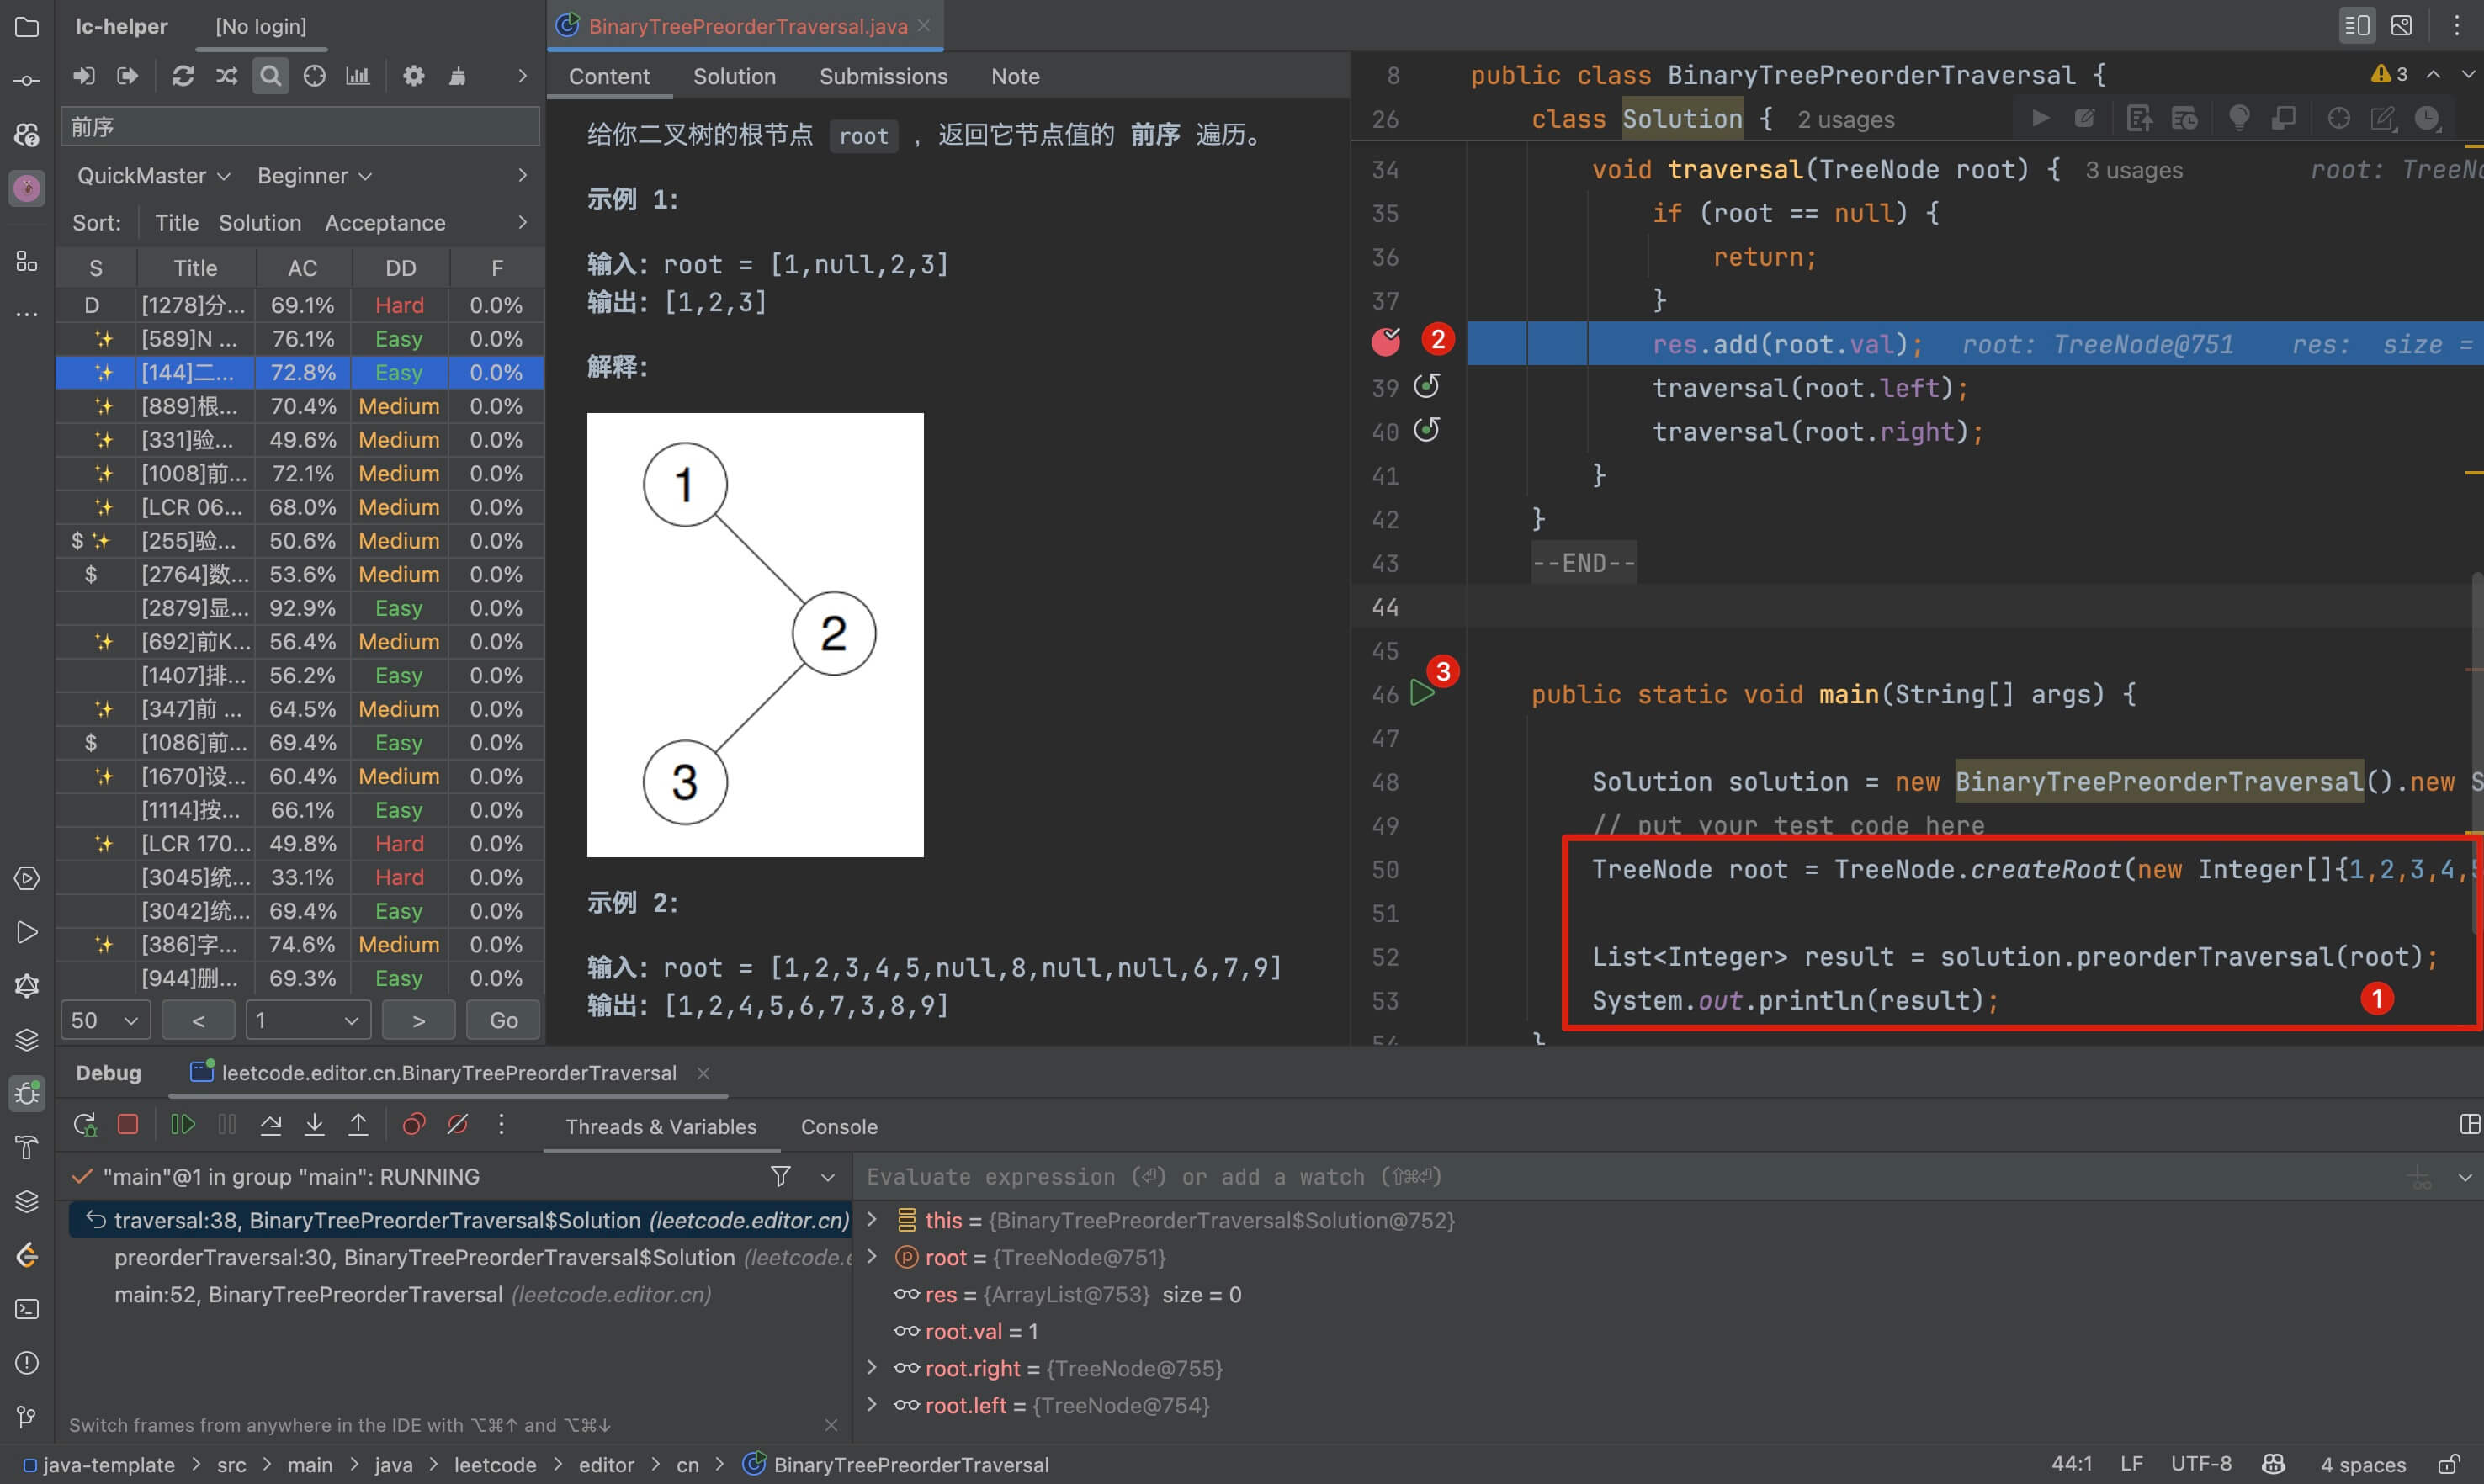
}After the configuration is complete, you can open the problem to write a solution, then add test code and set breakpoints in the main function to debug the Java algorithm:
C++
IDE:CLion
CodeType:C++
FilePath:
/<your>/<path>/<to>/lc-plugin-template/cpp-templateCodeFilename:
$!velocityTool.camelCaseName(${question.titleSlug})CodeTemplate:
\#include <iostream>
\#include <vector>
\#include <string>
\#include "../common/ListNode.cpp"
\#include "../common/TreeNode.cpp"
using namespace std;
${question.code}
int main() {
Solution solution;
// your test code here
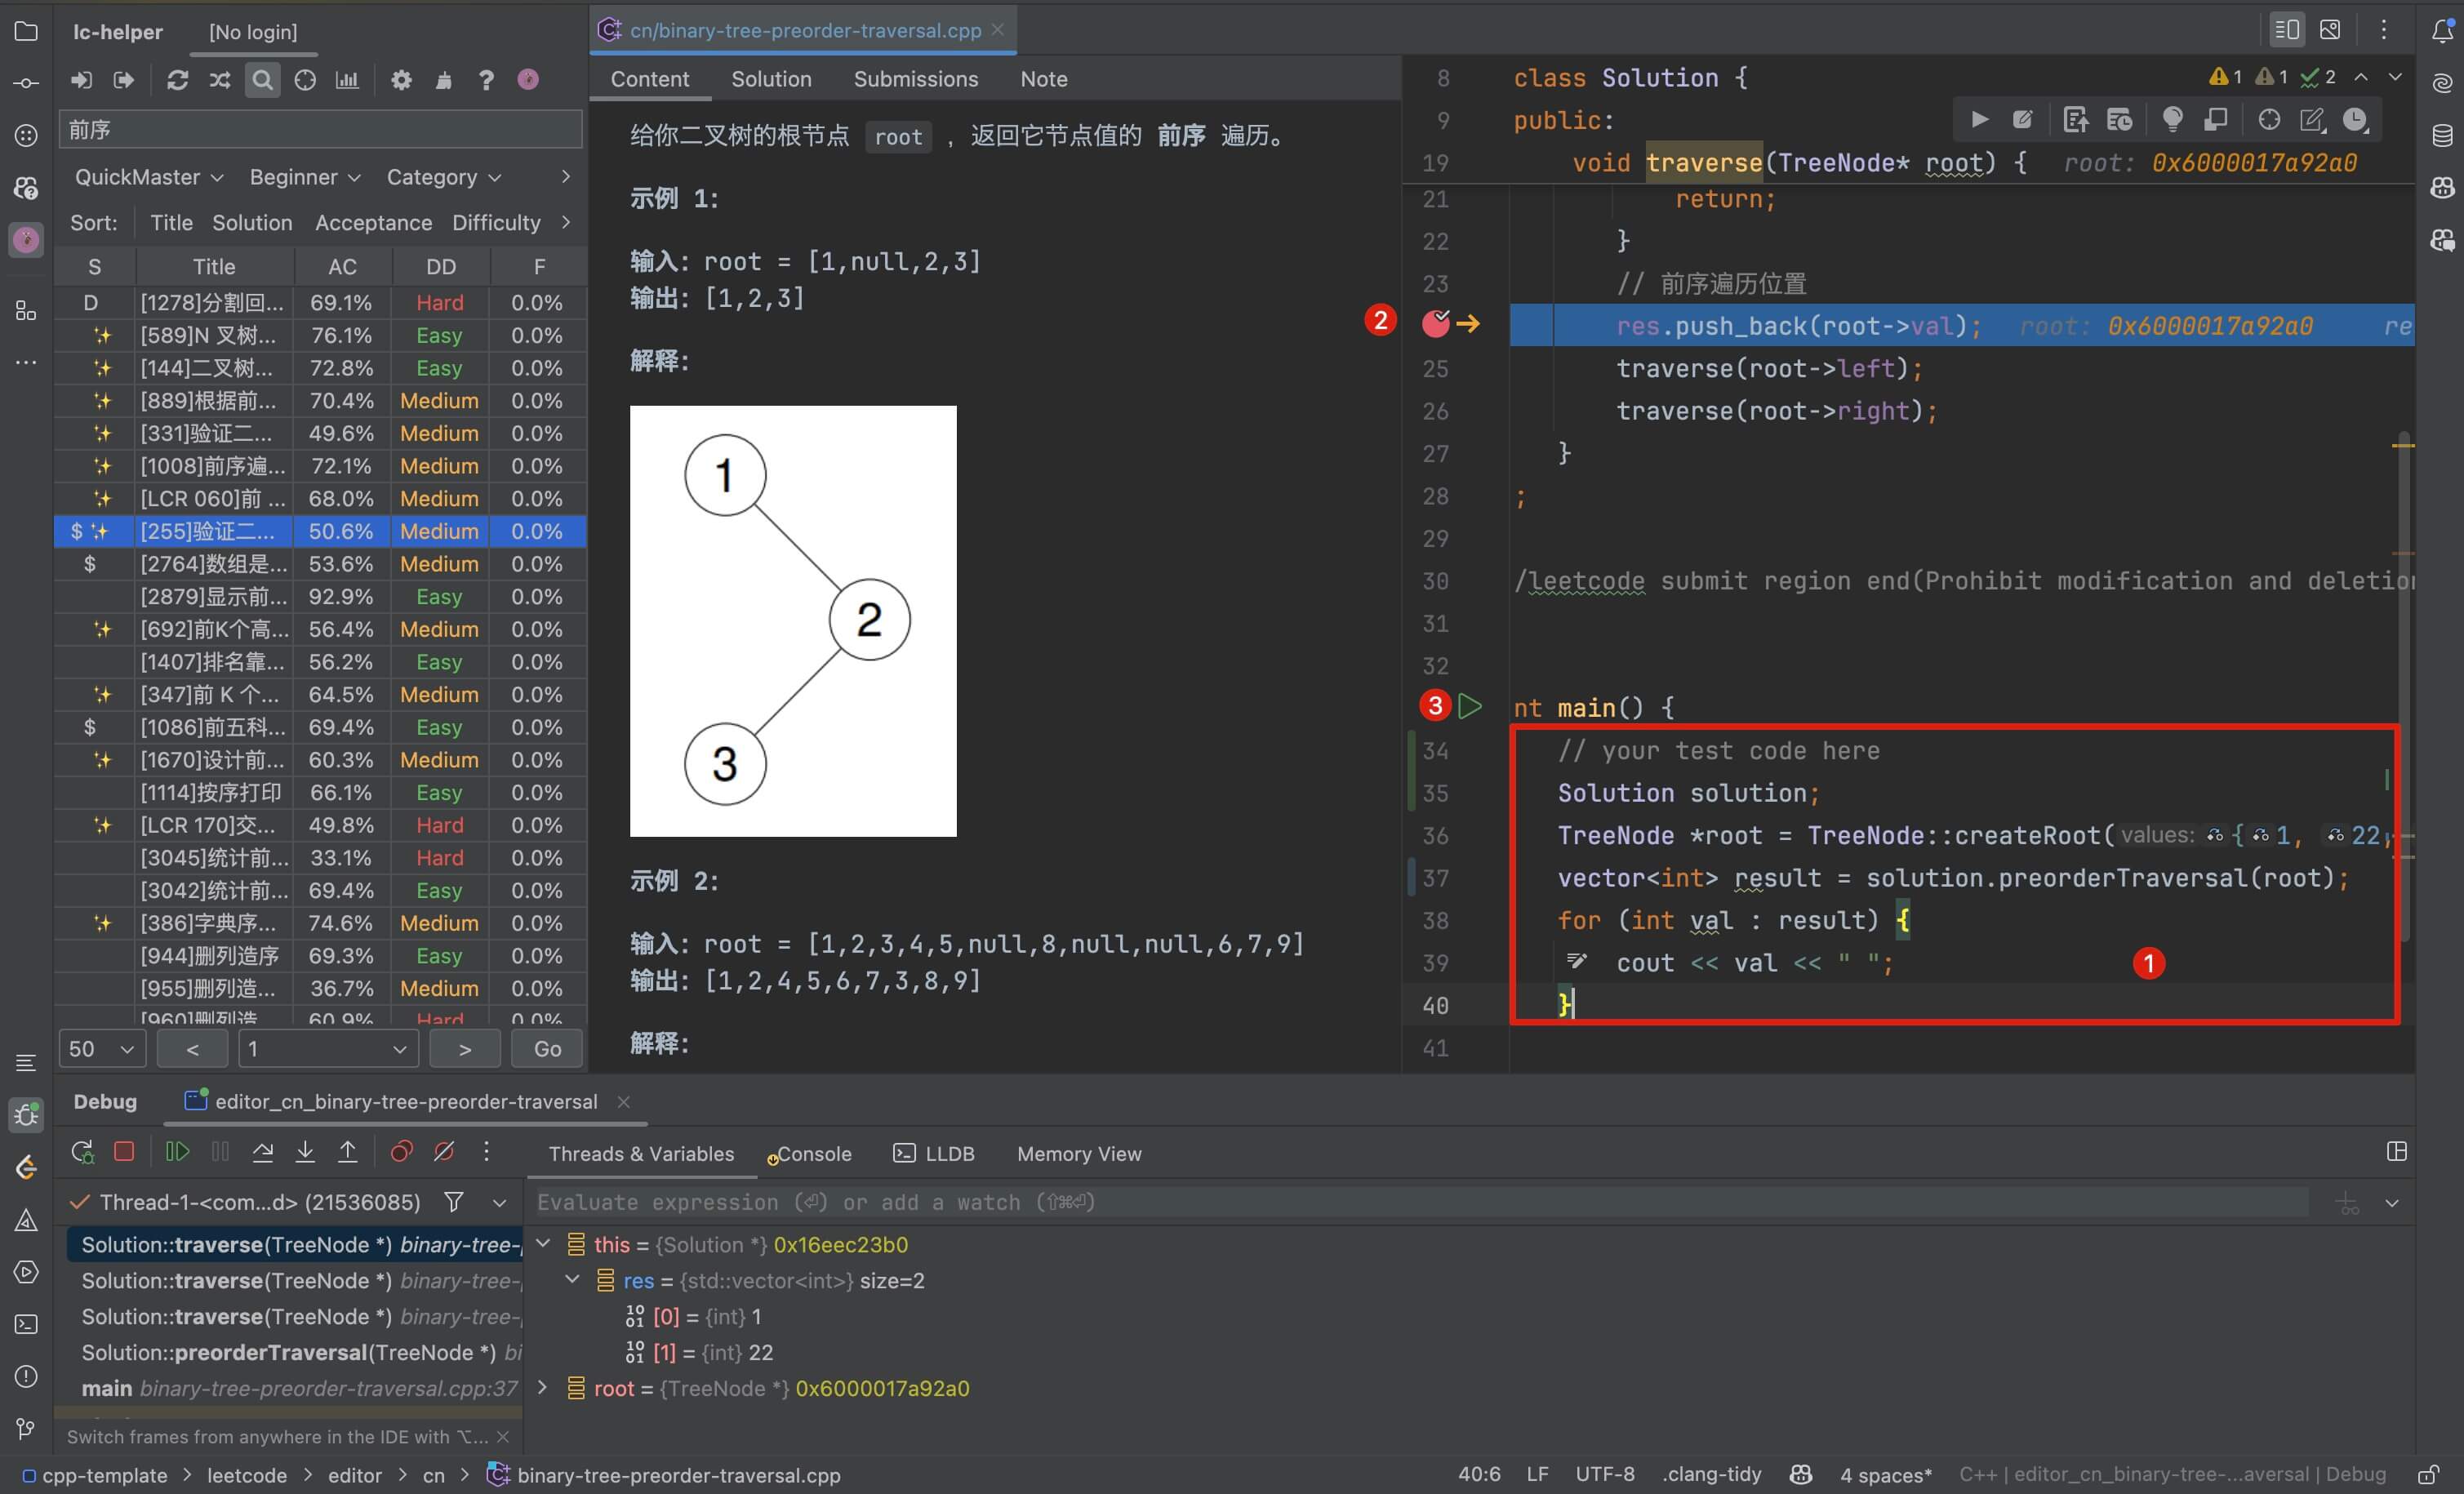
}After completing the configuration, you can open the problem to write a solution, then add test code in the main function and set breakpoints to debug the algorithm:
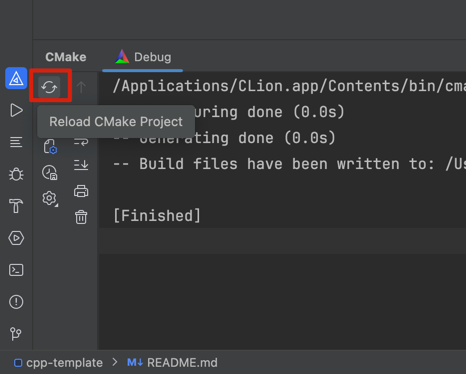
From my tests, when you open a new problem and create a new cpp code file, the IDE does not automatically refresh CMake, which prevents the new code file from compiling. You need to manually refresh CMake here:
Every time you open a new problem, you need to click this button to manually refresh, which is somewhat inconvenient. We can set a shortcut key to simplify this process.
In Clion's settings page, search for the keyword cmake.reload to set it up:
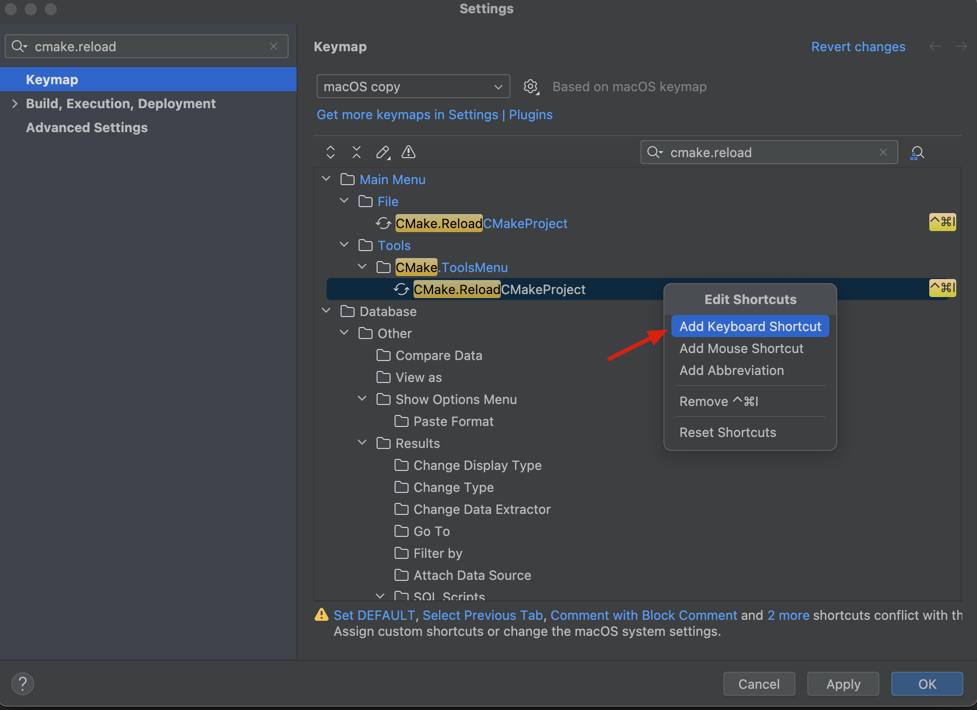
I set the shortcut key to Ctrl + Cmd + I, but you can set a shortcut key according to your own habits.
In this way, each time you open a new problem, you can quickly reload CMake by pressing the shortcut key, allowing you to debug the newly added code file.
Python
Jetbrains IDE:Pycharm
CodeType:Python3
FilePath:
/<your>/<path>/<to>/lc-plugin-template/python-templateCodeFilename:
$!velocityTool.camelCaseName(${question.titleSlug})CodeTemplate:
from typing import *
from leetcode.editor.common.node import *
${question.code}
if __name__ == '__main__':
solution = Solution()
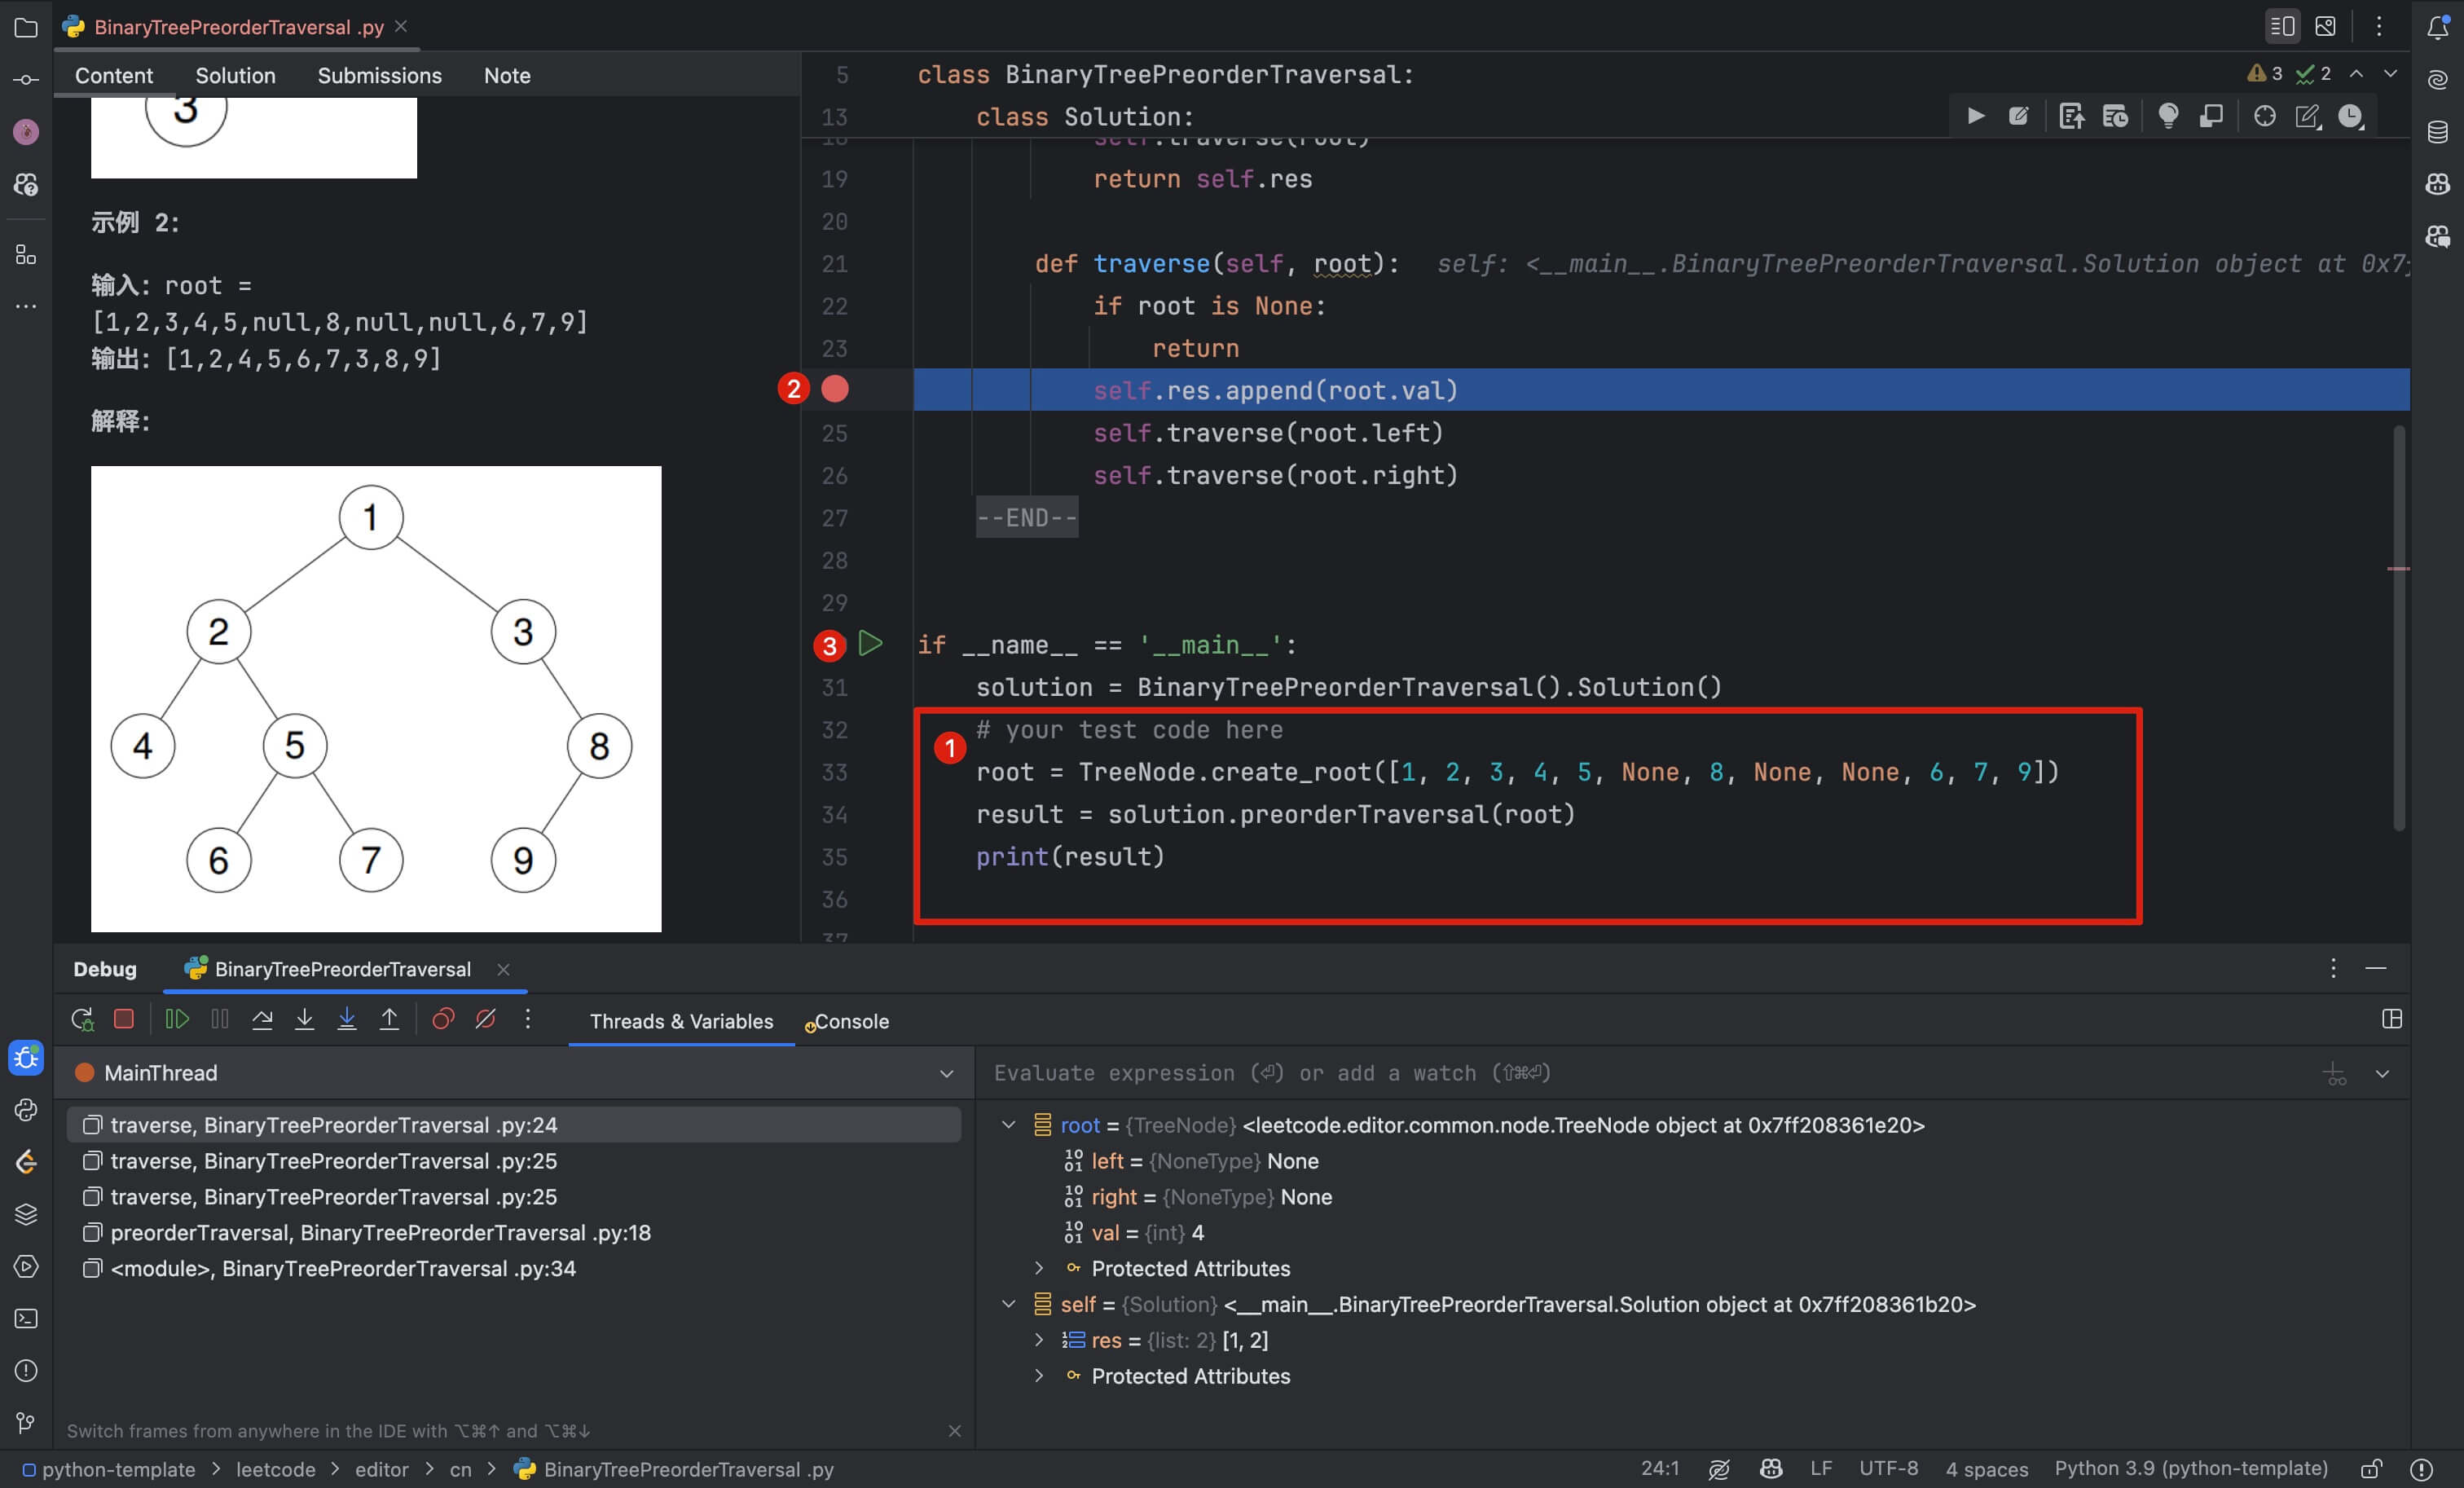
# your test code hereAfter setting up, you can open the problem to write a solution, then add test code and set breakpoints in the main function to debug Python algorithms:
Golang
Jetbrains IDE:Goland
CodeType:Go
FilePath:
/<your>/<path>/<to>/lc-plugin-template/golang-templateCodeFilename:
${question.titleSlug}_testCodeTemplate:
package leetcode_solutions
import "testing"
${question.code}
func Test$!velocityTool.camelCaseName(${question.titleSlug})(t *testing.T) {
// your test code here
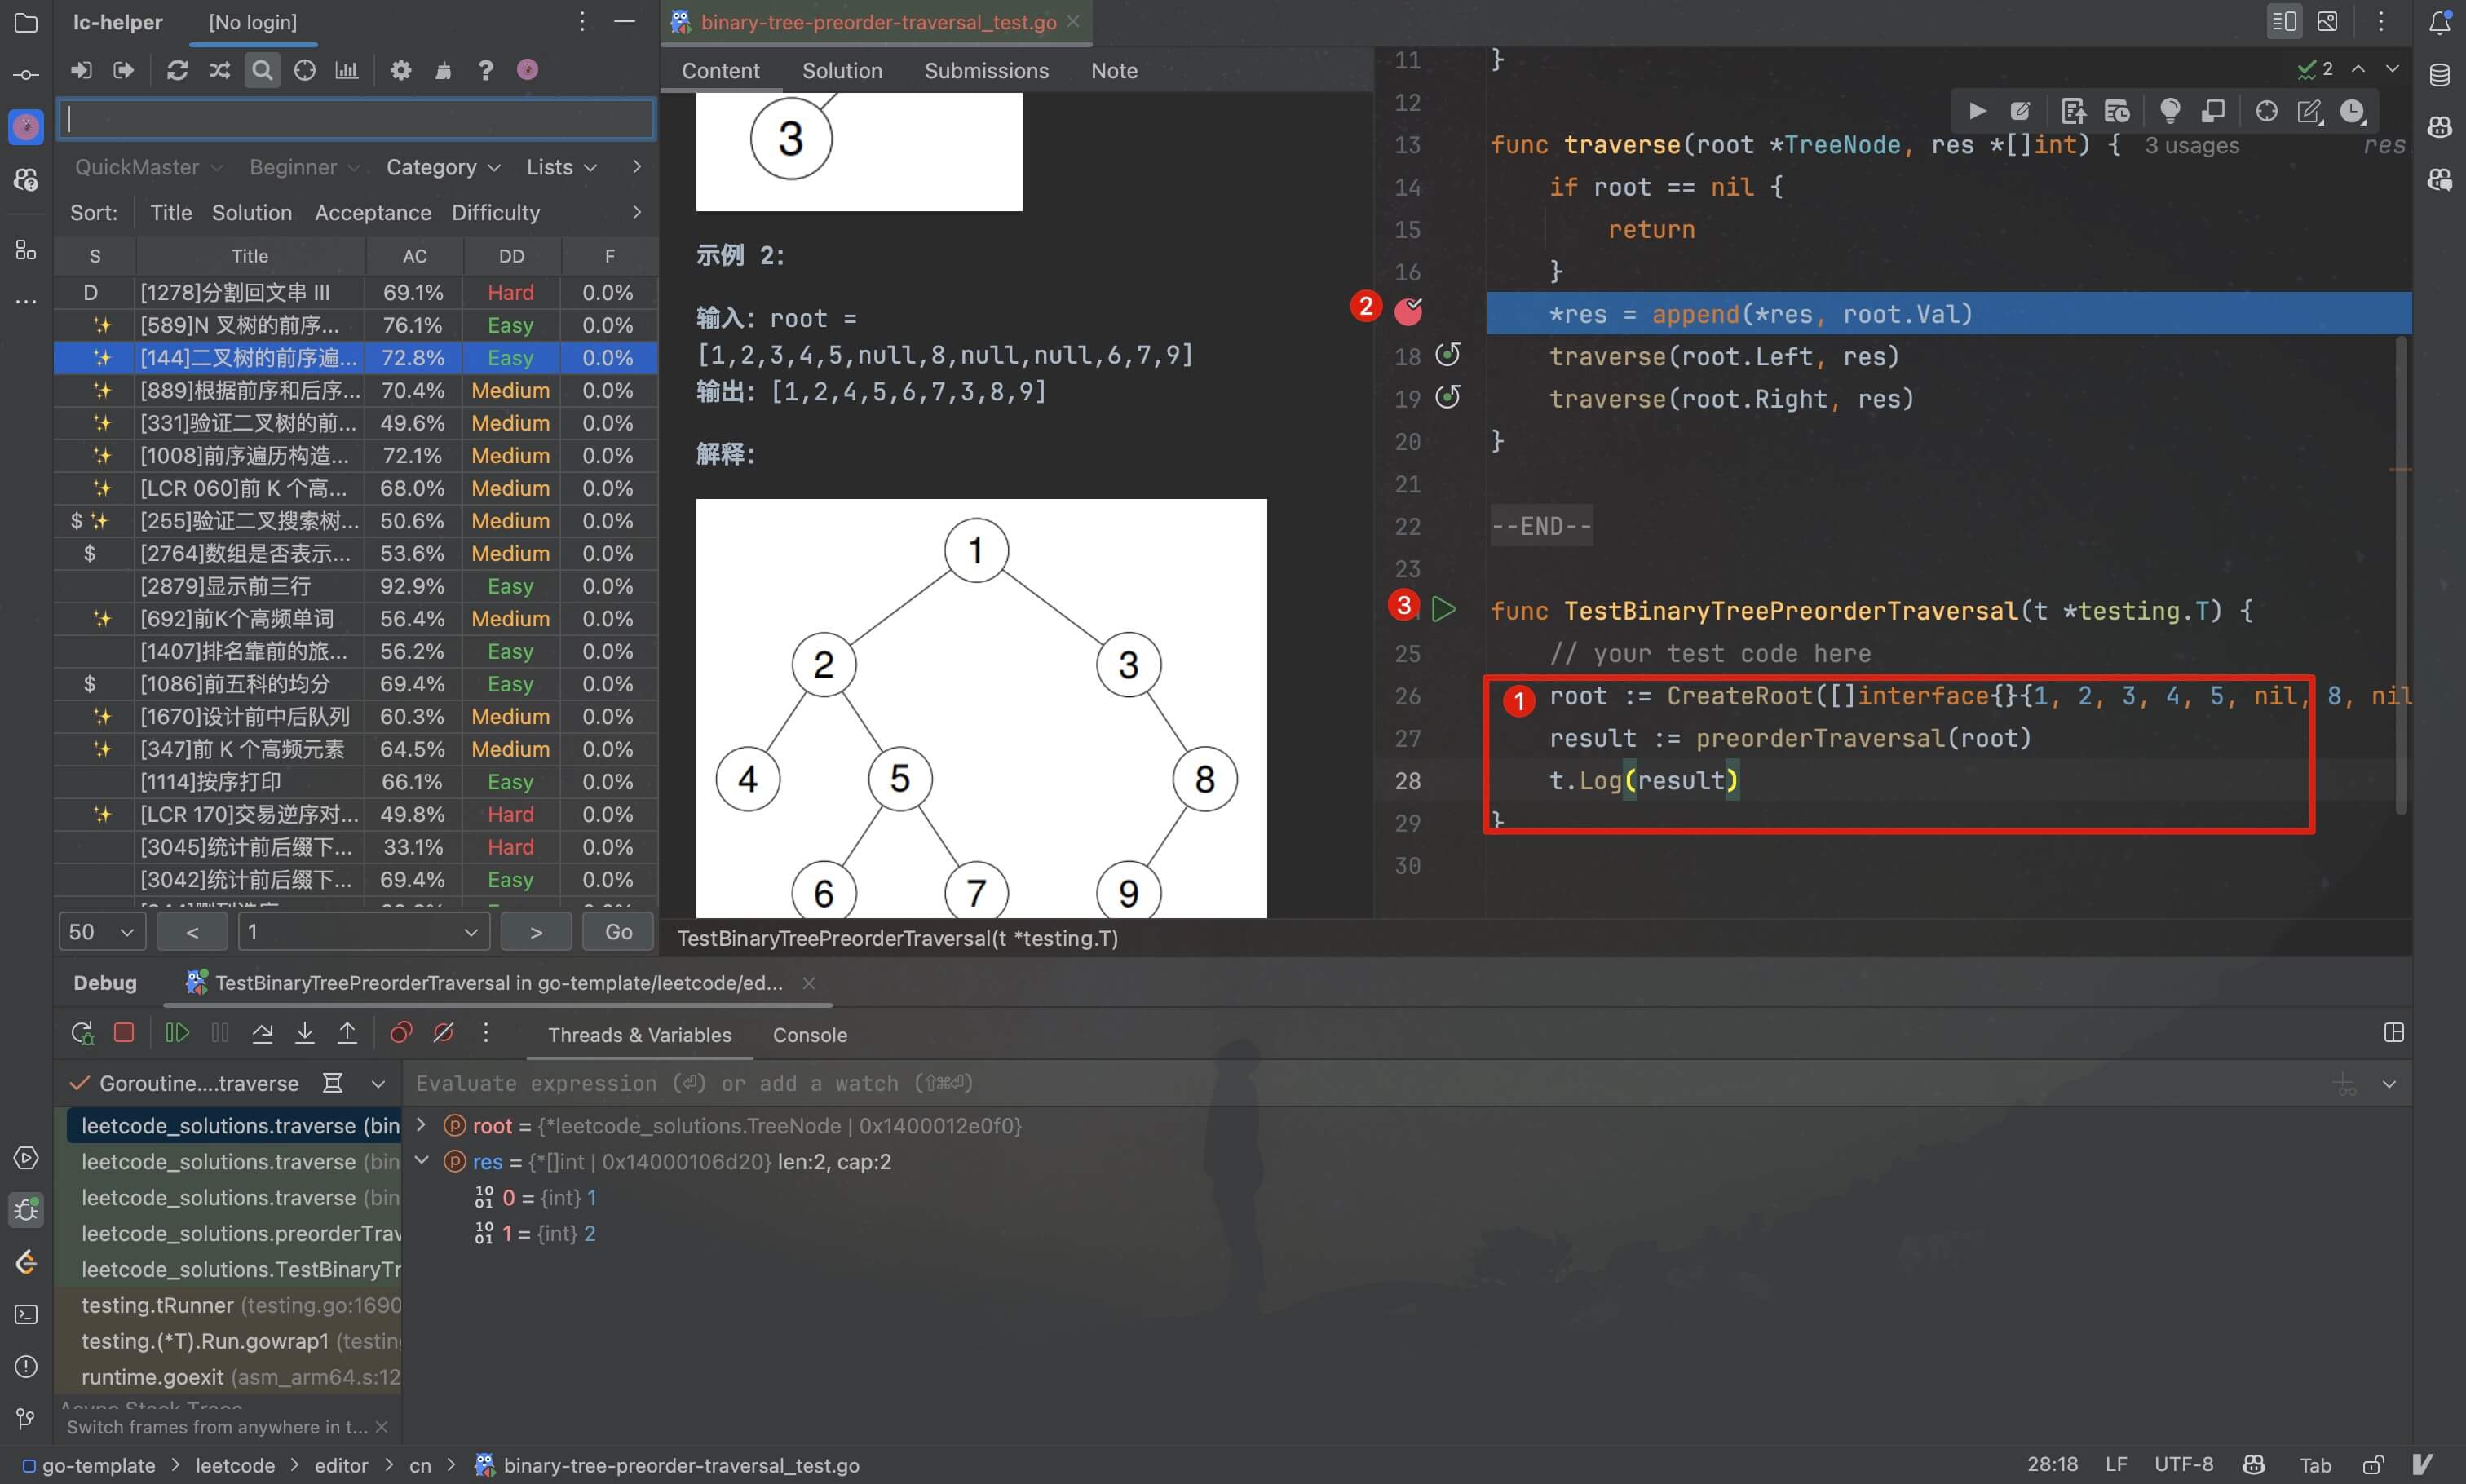
}Each package in Golang can only have one main function entry point. To bypass this limitation, we utilize the testing file mechanism in Golang, allowing each problem to be individually run and debugged.
After setting up the configuration, you can open the problem to write your solution. Add test code in the TestXXX function and set breakpoints to debug the algorithm:
JavaScript
Jetbrains IDE:WebStorm
CodeType:JavaScript
FilePath:
/<your>/<path>/<to>/lc-plugin-template/javascript-templateCodeFilename:
$!velocityTool.camelCaseName(${question.titleSlug})CodeTemplate:
import {ListNode} from "../common/listNode.js";
import {TreeNode} from "../common/treeNode.js";
${question.code}
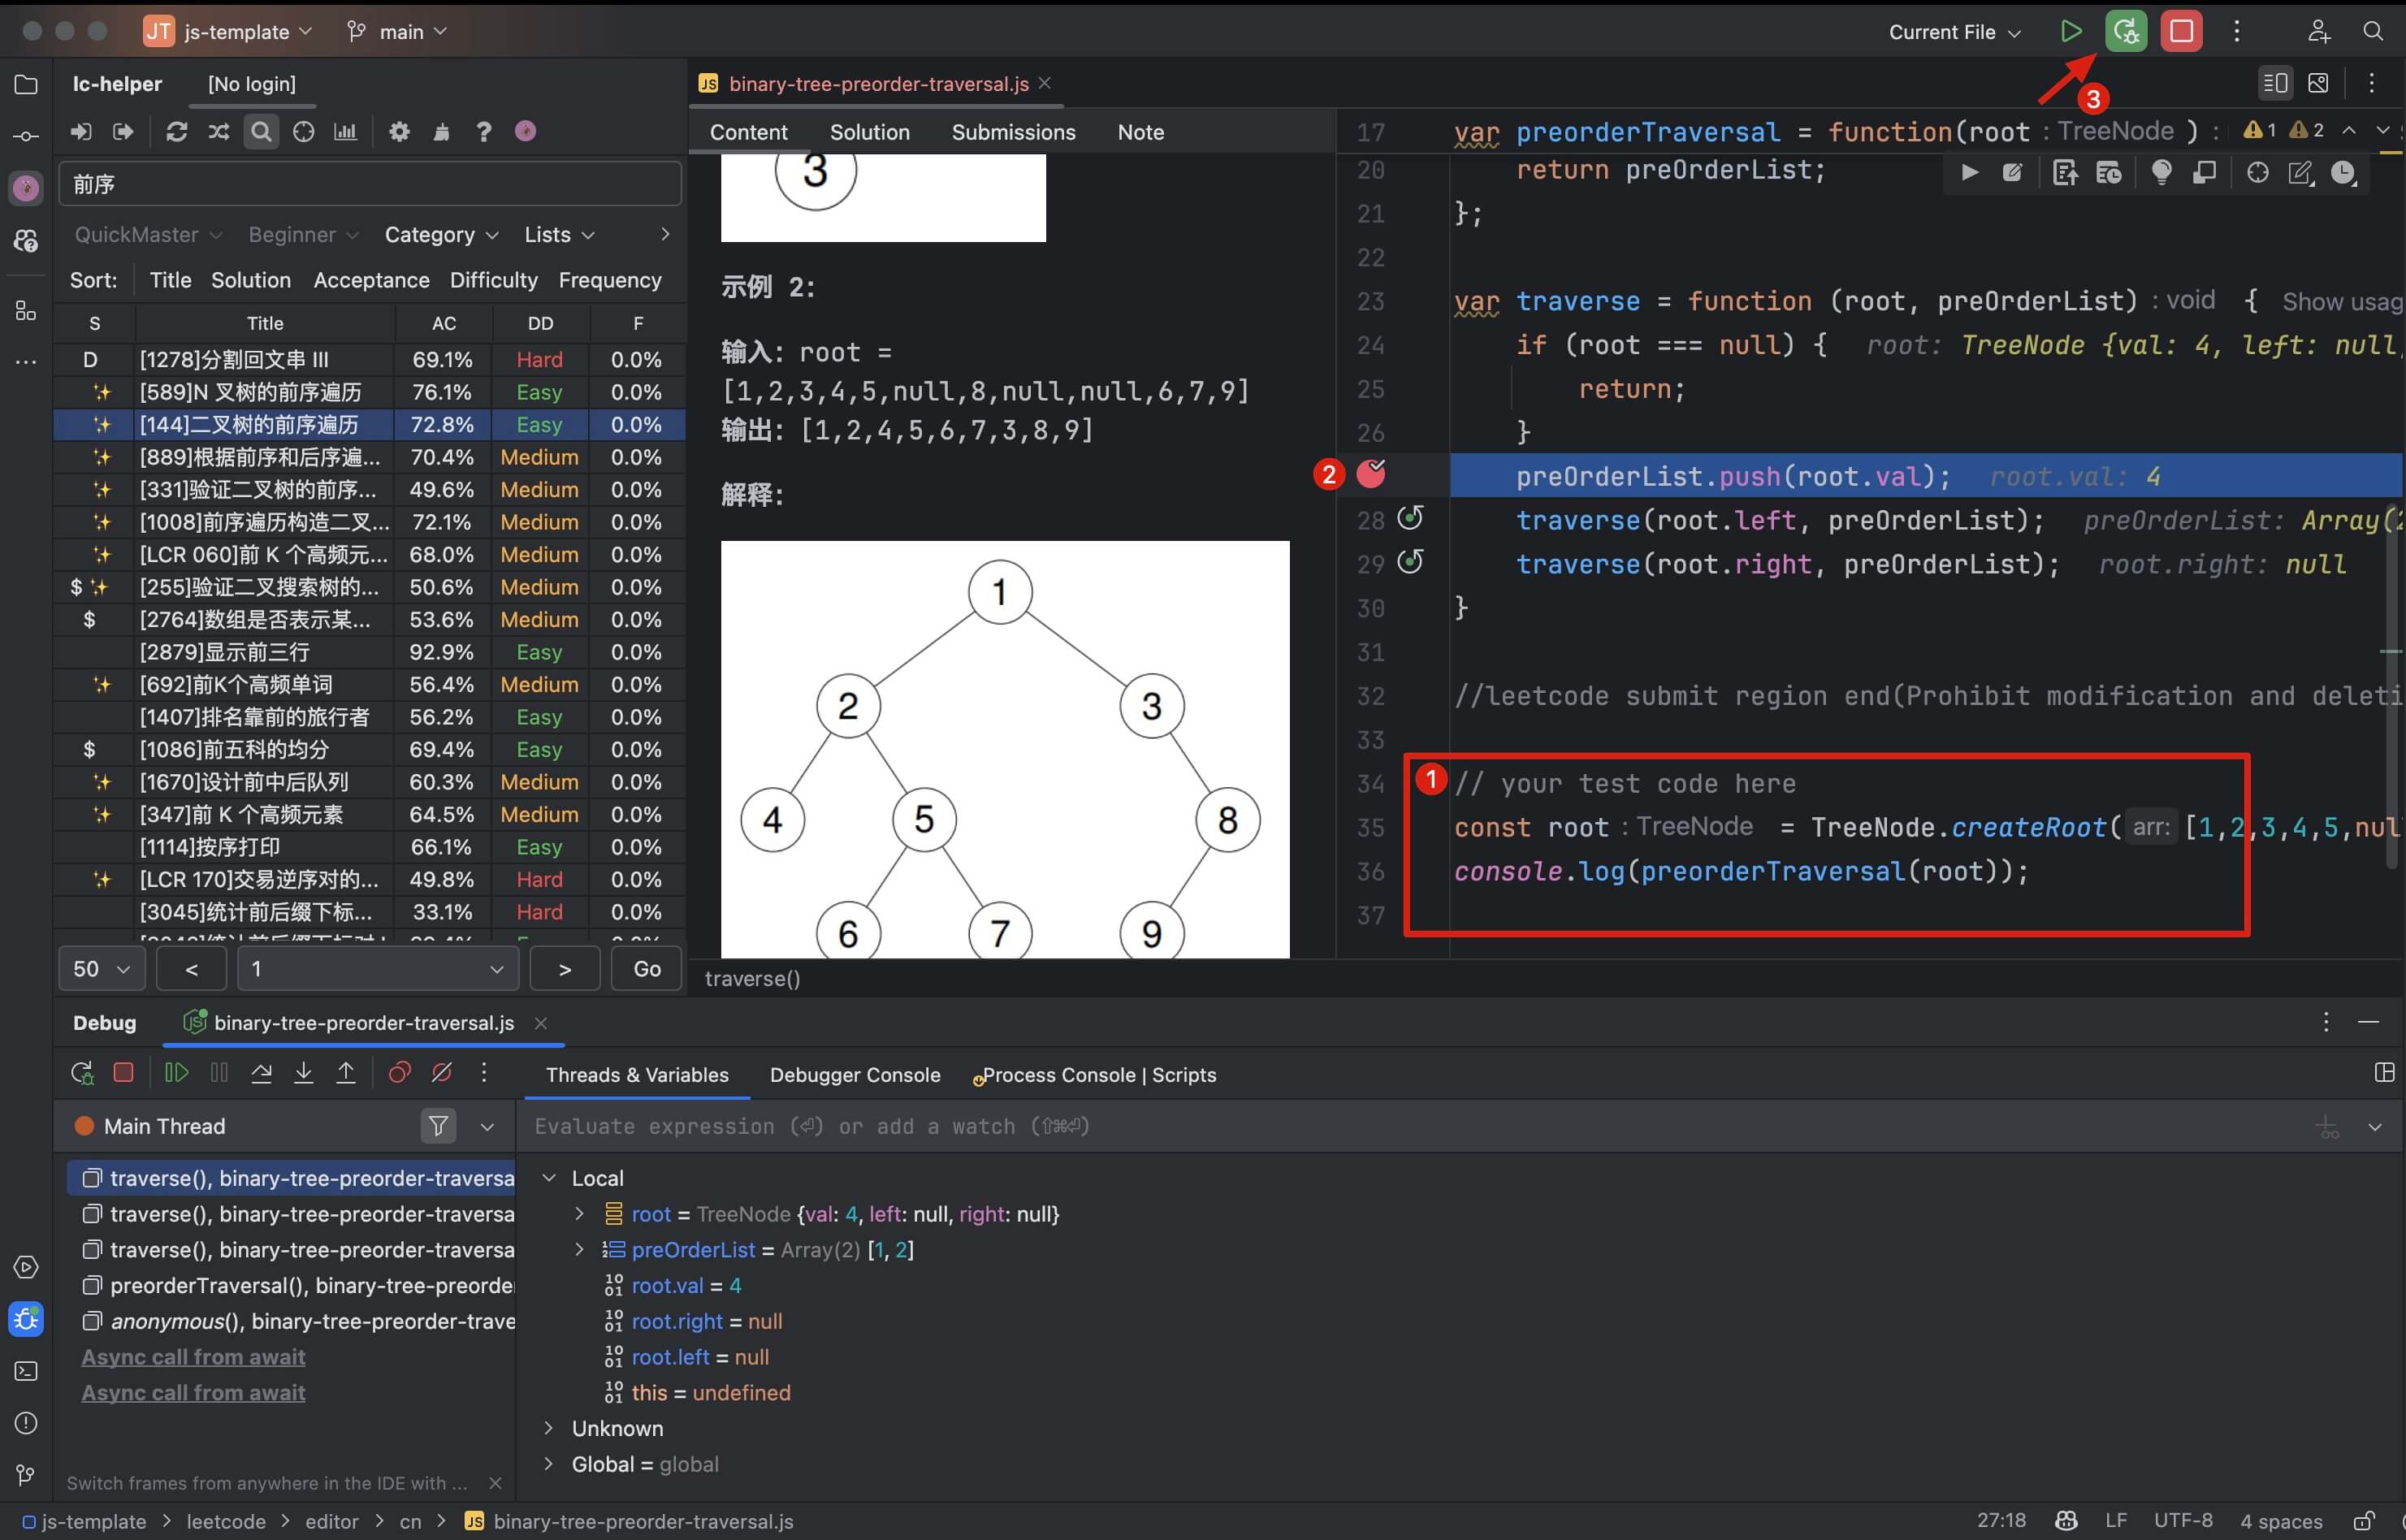
// your test code hereAfter the configuration is complete, you can open the problem to write solutions, add test code and set breakpoints. Click the Debug button in the upper right corner to debug the algorithm:
Update Method
JetBrains IDEs automatically detect updates and prompt you when updates are available. It is recommended to update to the latest version promptly to ensure the smoothest experience.
Changelog
For details, refer to the JetBrain Plugin Changelog.
Frequently Asked Questions
How to Debug Code Locally
To utilize the custom code template feature, please carefully refer to the "Local Code Debugging" section in the usage guide above.
Chinese Characters Garbled?
This issue generally does not occur with newer versions of IDEs and operating systems. If it does, you can refer to this post to modify the IDE's encoding to UTF-8.
Problem Page Suddenly Turns Blank?
Has your IDE been installed and used for a long time? Only heavy users of the IDE may encounter this bug. It is difficult to diagnose the cause, but it is likely related to some cache/internal configuration issues during the IDE upgrade process. The simplest solution is to download the latest version of the IDE from the official website and reinstall it locally (don't worry, your existing configurations will not be overwritten), and all problems should disappear.
No ✨ Mark in the Problem List?
If the problem list does not show the ✨ mark after logging in, you can manually refresh the labuladong solution data by clicking the website logo icon on the far right of the toolbar:
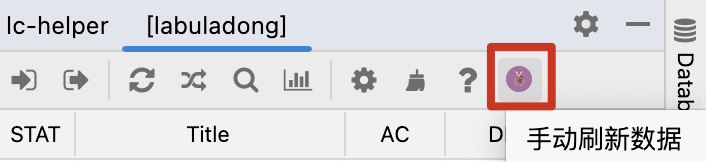
After waiting for about ten seconds, you will see a notification bar indicating "Manual refresh of labuladong data successful," and the ✨ mark will appear.
If there is still no response and no error is reported, it is most likely a network issue. Please try turning off the proxy or changing the network and refresh the data again.
✨ Mark Present but No Solution or Thought Buttons?
If the data retrieval is successful but the problem details page does not show the "labuladong Solution" and "labuladong Thought" buttons, it is because the IDE's file system cache has not been refreshed.
You can try manually clearing the IDE's cache and restarting the IDE:
Code Does Not Auto-Complete or Correct?
Code completion and correction are fundamental features of an IDE and are not related to plugins. If these features are not working, it is usually because your IDE is not properly configured or your code file is not recognized by the IDE.
For example, in the Go language, you need to add package main at the top of your code file for it to be recognized by the Goland IDE. You can use the "Local Debugging Code" feature introduced earlier to automatically add this line.
Similarly, for Java files, they need to be part of a Java project to be recognized by the IDE. You can modify the plugin settings by setting TempFilePath to your project path and configuring Code Template to automatically add the package name. This way, the code file will be saved in the project, and the IDE will recognize it and provide code completion.
No Code Submission Button?
Older plugin versions might have this issue. Please ensure you are using the latest version of the plugin. Generally, when you move your mouse to the code editing area, buttons for submission, testing, etc., should appear in the upper right corner.
Additionally, right-clicking in the code file will also display options for submission, testing, and other functions.
Bug Reporting
You can create an issue on GitHub to report problems: